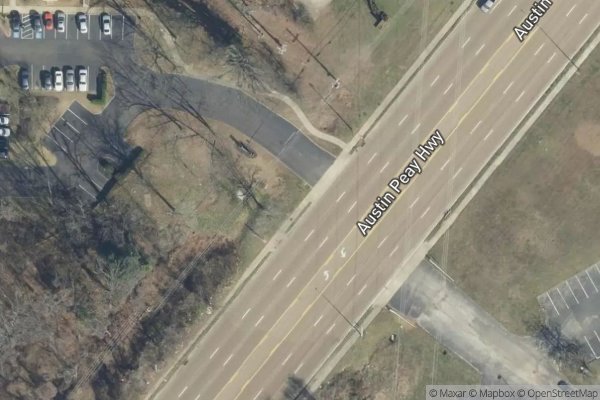
CASA GRACE
3815 Austin Peay Hwy
Income Based
Calculated by HUD
Seniors 62+46 Units
View Property
Browse 141 property records identified in HUD data with Section 811 indicators in Tennessee. Confirm current assistance and property-specific requirements directly.
HUD source-data date: not recorded. Data compilation and directory sync dates are not the HUD observation date.
Sources: HUD, USDA Rural Development, HUD LIHTC Database. See HUD's multifamily program descriptions and Section 811 program page.
This preliminary check is not an eligibility decision. Confirm rules with the administering agency.
HUD Section 811 has distinct capital-advance/PRAC and state-administered PRA approaches. Income targets, disability criteria, referrals, rent calculations, accessibility, services, and application processes can vary. A source-data indicator does not prove assistance is currently active. Confirm the program model and requirements with the property or its administering agency; see HUD's Section 811 program information.
24 properties
View income and AMI reference data for memphis3815 Austin Peay Hwy
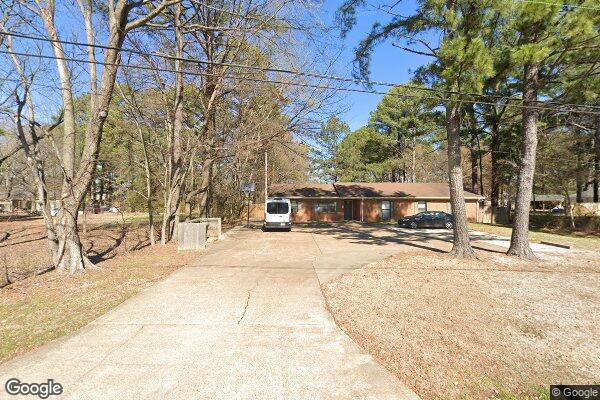
5542 CRESTVIEW DR
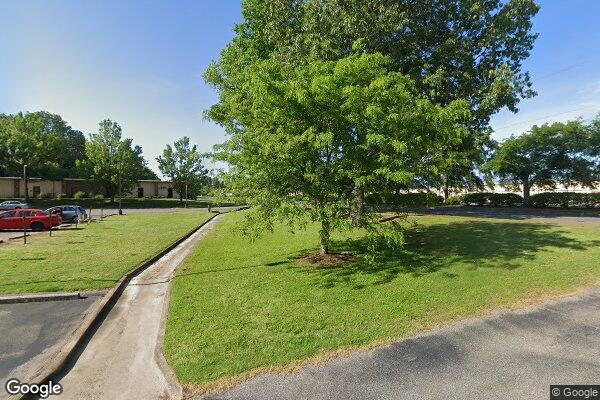
1456 Gillham Dr
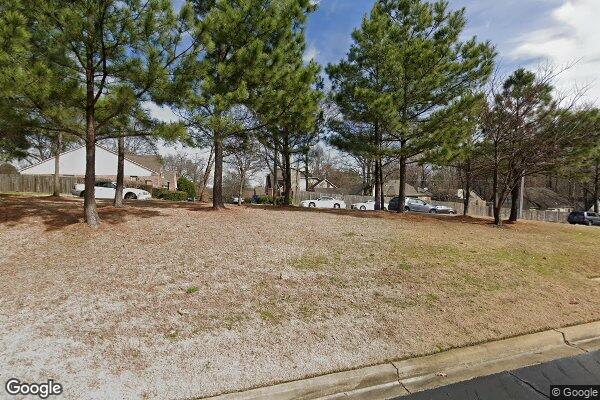
5819 Newberry Ave
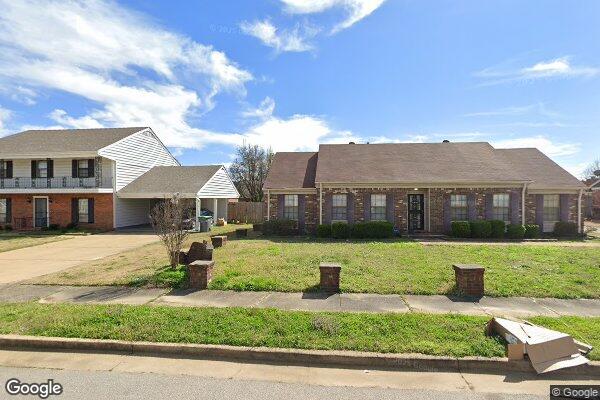
6602 KIRBY MEADOWS CV
1373 FAXON AVE
14 properties
View income and AMI reference data for knoxville
2112 Thurman Ln
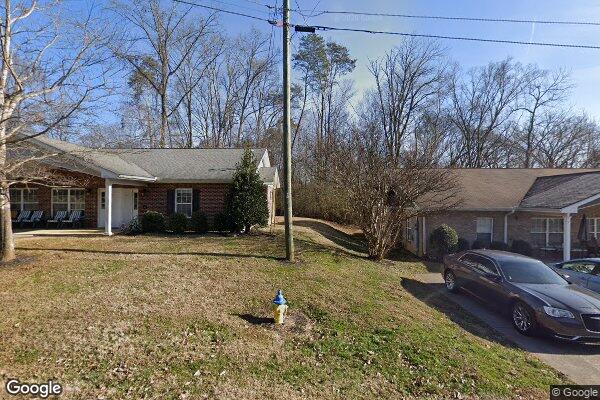
2130 Thurman Ln
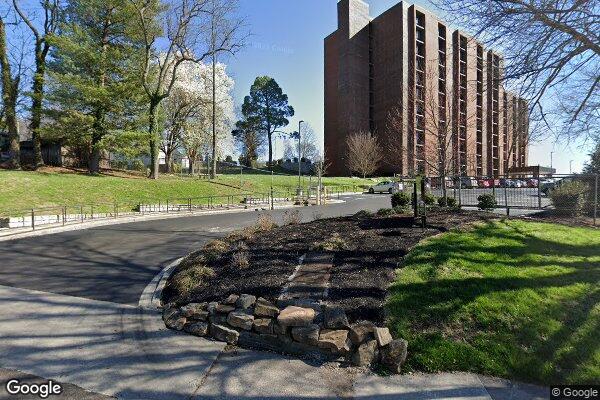
1508 McCroskey AVE
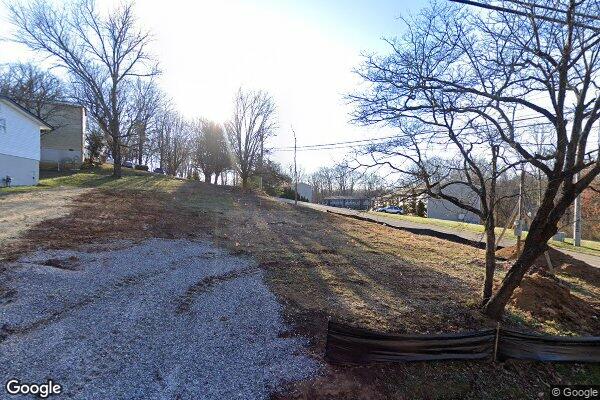
1903 Piney Grove Church RD
5845 E Governor John Sevier Hwy
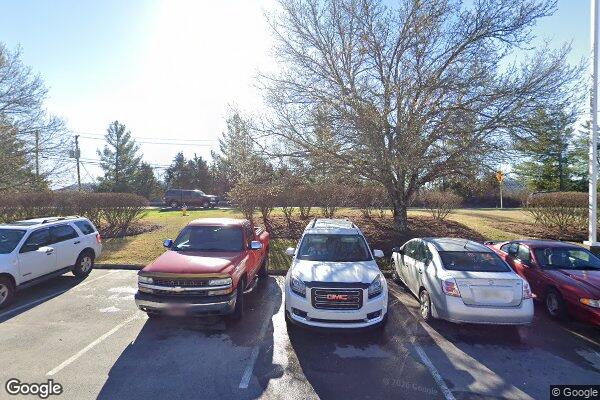
4129 E Emory Rd
12 properties
View income and AMI reference data for chattanooga
335 North Seminole Drive
7433 MINTOM DR
2739 FOLTS DR
3770 Wilcox Blvd
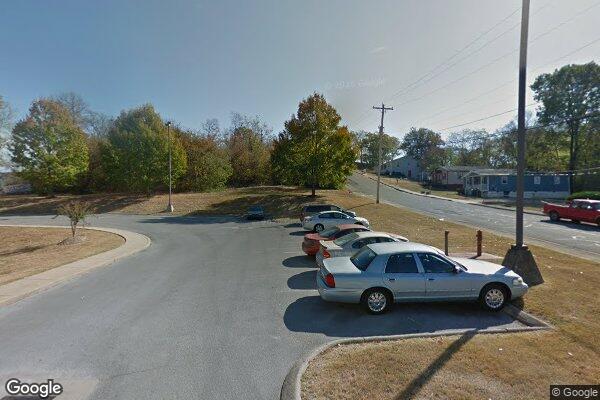
1627 E 5th St
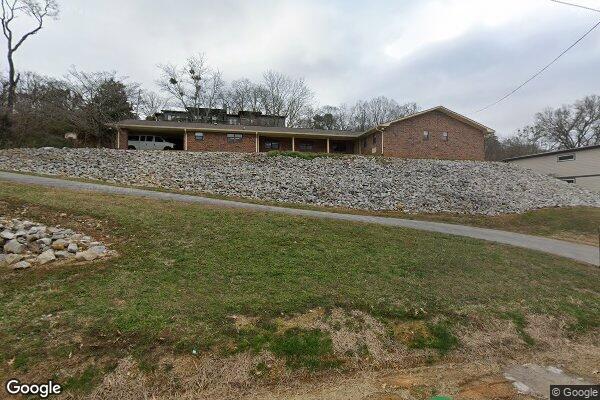
700 Ladd Ave
10 properties
View income and AMI reference data for nashville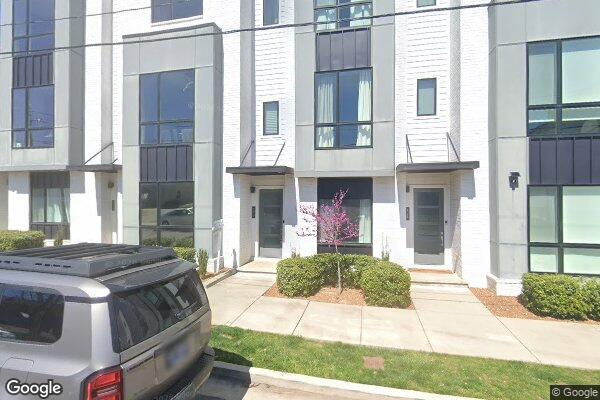
1015 Scovel St
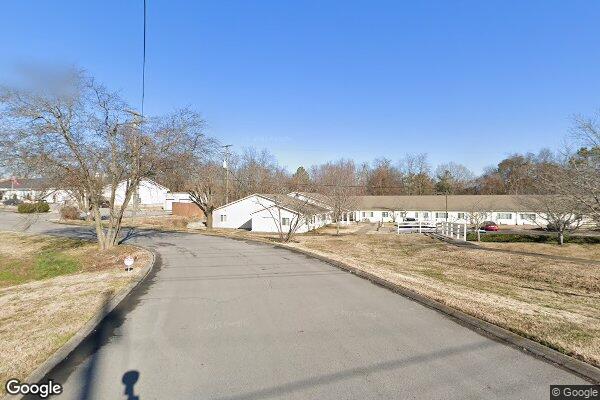
2737 McCampbell Avenue
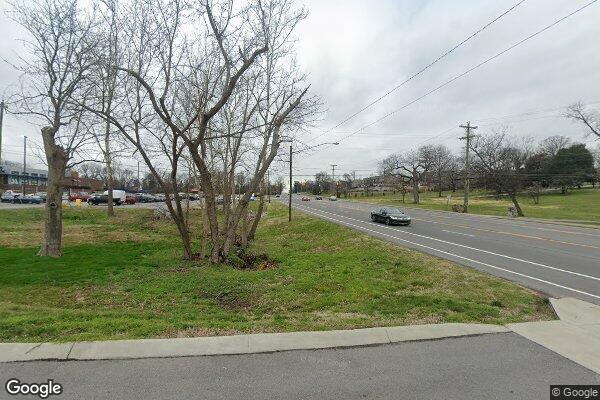
3015 Lebanon Pike
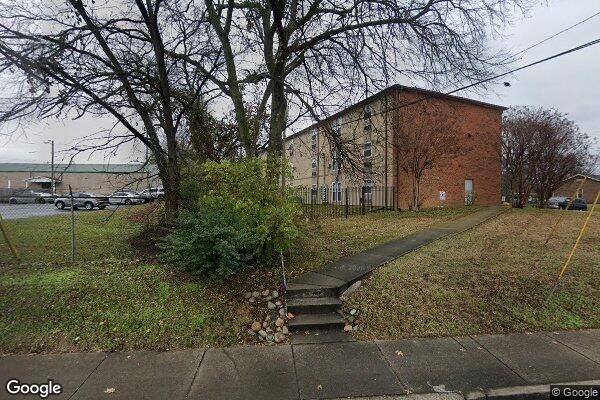
2020 Ed Temple Blvd
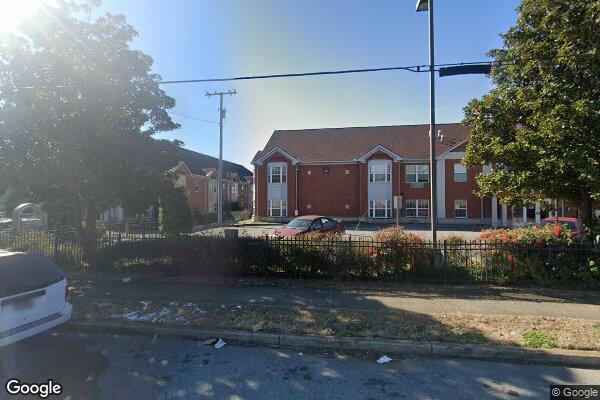
521 Spruce Street
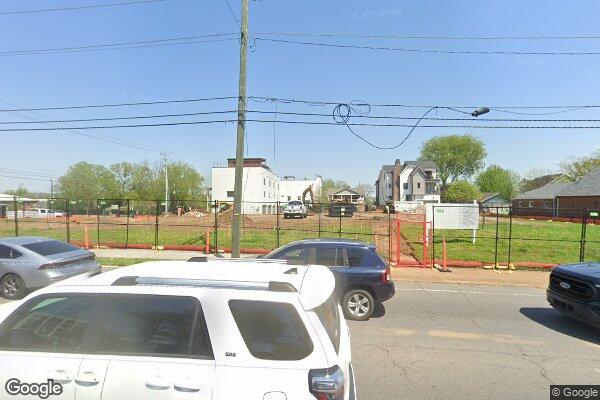
1622 Rosa l. Parks Bllvd.
9 properties
View income and AMI reference data for johnson city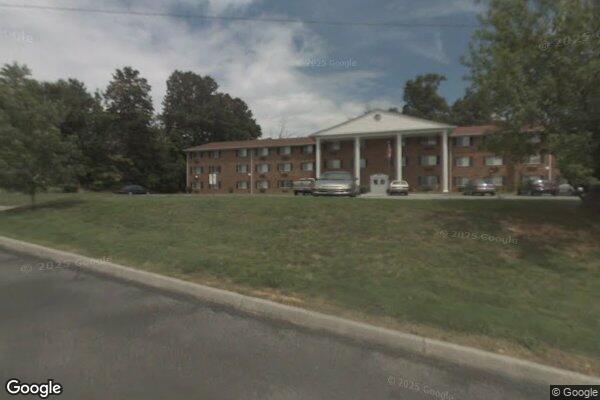
810 Briarcliff RD
1113 KING SPRINGS RD
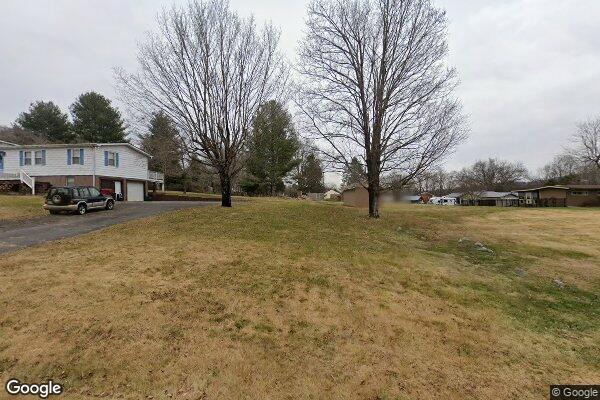
806 Dresden Ave
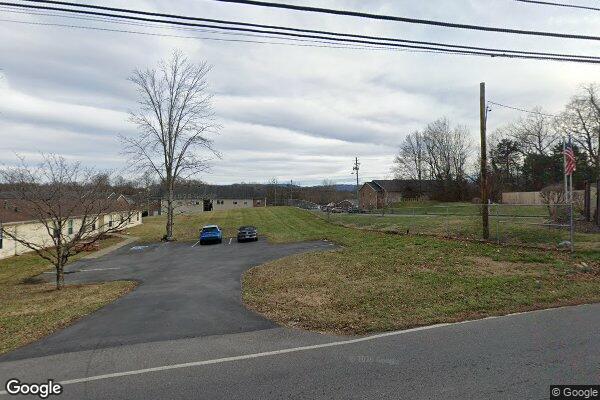
516 SWADLEY RD
2802 Plymouth RD
1507 BELL RIDGE RD
8 properties
View income and AMI reference data for kingsport
1252 Bloomingdale Pike
108 Wampler Street
1813 HILLTOP DR
2301 E Center ST
1800 MOUNTAIN VIEW RD
1924 BOWATER DR
HUD Small Area Fair Market Rents (SAFMR) are rental benchmarks used in housing programs; they do not set each voucher household's payment standard across Tennessee (TN). Across 56 HUD FMR areas and 141 listed communities in Tennessee (1,097 LIHTC tax credit, 365 Project-Based Section 8, 250 Section 202 senior, 295 USDA Rural Development), the property-location-weighted Fair Market Rent summary is $1,070/month for a 1-bedroom and $1,257/month for a 2-bedroom. Local Public Housing Agencies set their own voucher payment standards. The 90%–110% figures below are illustrative calculations from FMR, not guaranteed or official local payment standards.
| Unit Size | Illustrative 90% of FMR | Property-location-weighted FMR | Illustrative 110% of FMR | TN ZIP FMR Range (Min – Max) |
|---|---|---|---|---|
| Studio / Efficiency | $917/mo | $1,019/mo | $1,121/mo | $640 – $2,130/mo |
| 1 Bedroom | $963/mo | $1,070/mo | $1,177/mo | $700 – $2,230/mo |
| 2 Bedroom | $1,131/mo | $1,257/mo | $1,382/mo | $930 – $2,440/mo |
| 3 Bedroom | $1,460/mo | $1,622/mo | $1,785/mo | $1,110 – $3,120/mo |
| 4 Bedroom | $1,691/mo | $1,878/mo | $2,066/mo | $1,220 – $3,800/mo |
Source: HUD Small Area Fair Market Rents (SAFMR). Geography: property ZIP-code locations in Tennessee. Dataset year: not recorded in the local FMR table. The 90% and 110% columns are illustrative calculations; local PHAs set their own voucher payment standards.
| HUD Metro / FMR Area | Studio | 1 BR | 2 BR | 3 BR | 4 BR | HUD 4-Person Median Family Income | HUD fiscal year | Properties |
|---|---|---|---|---|---|---|---|---|
| Nashville-Davidson--Murfreesboro--Franklin, TN HUD Metro FMR Area54 ZIPs | $1,410 | $1,470 | $1,619 | $2,063 | $2,515 | $108,383 | FY2026 | 410 |
| Memphis, TN-MS-AR HUD Metro FMR Area35 ZIPs | $991 | $1,084 | $1,202 | $1,586 | $1,847 | $87,558 | FY2026 | 269 |
| Knoxville, TN HUD Metro FMR Area35 ZIPs | $1,094 | $1,103 | $1,368 | $1,738 | $2,022 | $89,281 | FY2026 | 168 |
| Chattanooga, TN-GA MSA28 ZIPs | $1,041 | $1,098 | $1,274 | $1,599 | $1,712 | $86,658 | FY2026 | 125 |
| Jackson, TN HUD Metro FMR Area7 ZIPs | $845 | $933 | $1,223 | $1,634 | $1,699 | $76,206 | FY2026 | 66 |
| Kingsport-Bristol, TN-VA MSA9 ZIPs | $721 | $828 | $1,029 | $1,338 | $1,485 | $68,082 | FY2026 | 64 |
| Morristown, TN HUD Metro FMR Area8 ZIPs | $839 | $850 | $1,087 | $1,393 | $1,750 | $78,124 | FY2026 | 46 |
| Johnson City, TN MSA7 ZIPs | $914 | $923 | $1,159 | $1,436 | $1,593 | $80,191 | FY2026 | 44 |
| Haywood County, TN2 ZIPs | $702 | $710 | $930 | $1,232 | $1,429 | $59,599 | FY2026 | 34 |
| Clarksville, TN-KY HUD Metro FMR Area6 ZIPs | $1,115 | $1,131 | $1,372 | $1,888 | $2,282 | $83,296 | FY2026 | 30 |
| Cumberland County, TN4 ZIPs | $719 | $729 | $948 | $1,276 | $1,432 | $74,213 | FY2026 | 27 |
| Giles County, TN4 ZIPs | $759 | $775 | $999 | $1,223 | $1,358 | $91,954 | FY2026 | 25 |
Source: HUD User Income Limits and HUD SAFMR. Each row is a HUD area represented by listed property locations; the displayed HUD fiscal year is the latest available for that area. HUD income limits are reference data and do not establish official LIHTC/MTSP limits.
| Property-Location-Weighted Indicator | Tennessee Property-Location Summary |
|---|---|
| Median gross rent (U.S. Census ACS) | $990/mo |
| Property-location-weighted 2-Bedroom HUD Fair Market Rent (SAFMR) | $1,257/mo |
| Estimated property-location-weighted 4-person income benchmark | $75,251/yr |
| Median household income (Census ACS) | $57,054/yr |
| Renter-occupied housing share | 40% |
| Cost-burdened renters (spending 30%+ of income on rent) | 47.7% |
| Severely cost-burdened renters (spending 50%+ of income on rent) | 23.2% |
Source: U.S. Census ACS 5-year ZIP-code data and HUD SAFMR. Geography: ZIP-code locations represented by listed properties in Tennessee. Dataset year: not recorded or mixed in the local data. The summary is property-location-weighted and is not an official statewide qualification limit.
Methodology: Fair Market Rent benchmarks are summarized from HUD Small Area Fair Market Rents (SAFMR), HUD income limits by their latest available fiscal year, and U.S. Census ACS 5-year ZIP-code estimates across represented property locations in Tennessee. The local dataset does not record an FMR year. Local Public Housing Agencies (PHAs) establish their own payment standards; the 90%–110% figures are illustrative calculations only.