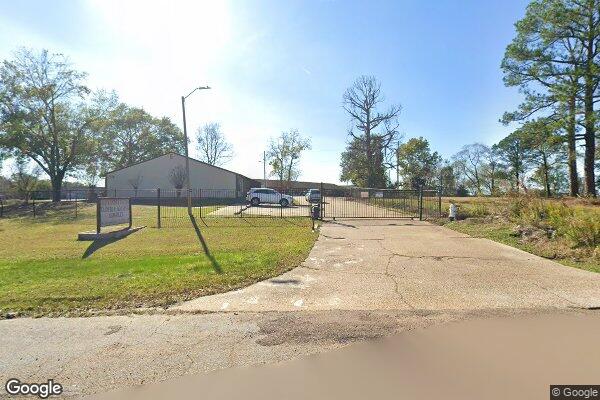
Alexander Waites Elderly Housing
4435 MEDGAR EVERS BLVD
Income Based
Calculated by HUD
Seniors 62+50 Units
View Property
Browse 64 property records identified in HUD data with Section 811 indicators in Mississippi. Confirm current assistance and property-specific requirements directly.
HUD source-data date: not recorded. Data compilation and directory sync dates are not the HUD observation date.
Sources: HUD, USDA Rural Development, HUD LIHTC Database. See HUD's multifamily program descriptions and Section 811 program page.
This preliminary check is not an eligibility decision. Confirm rules with the administering agency.
HUD Section 811 has distinct capital-advance/PRAC and state-administered PRA approaches. Income targets, disability criteria, referrals, rent calculations, accessibility, services, and application processes can vary. A source-data indicator does not prove assistance is currently active. Confirm the program model and requirements with the property or its administering agency; see HUD's Section 811 program information.
11 properties
View income and AMI reference data for jackson4435 MEDGAR EVERS BLVD
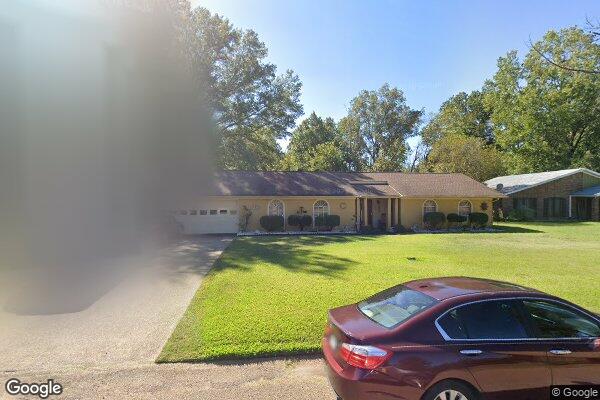
Cooper Road
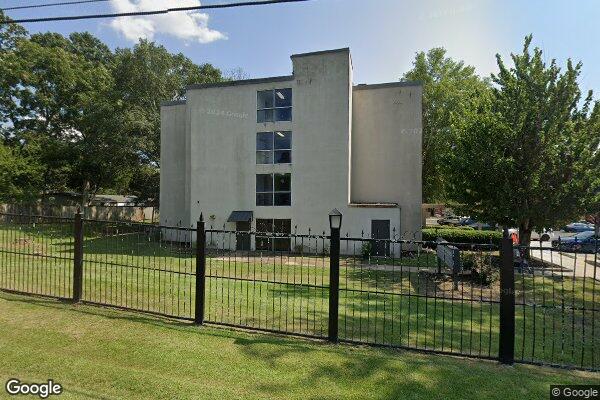
811 FOREST AVE
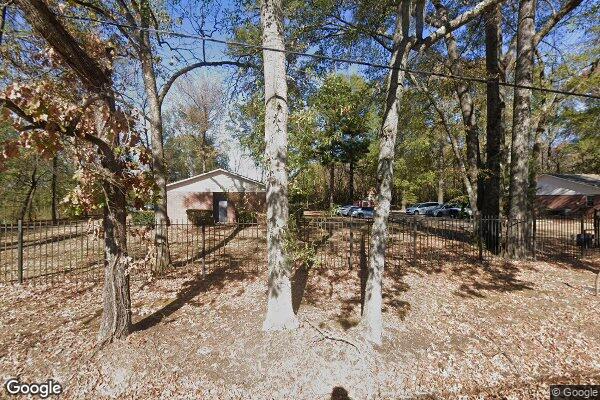
168 FERNWOOD ST
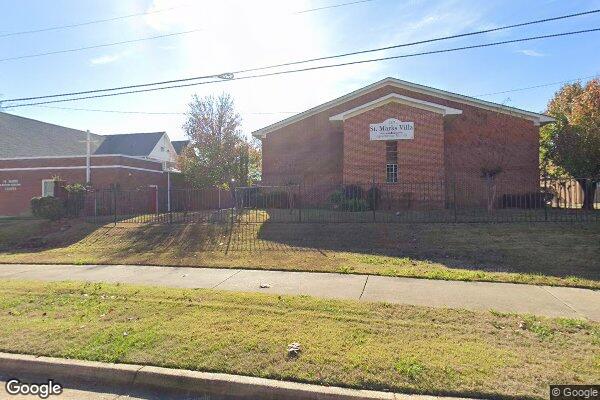
917 West Pearl Street
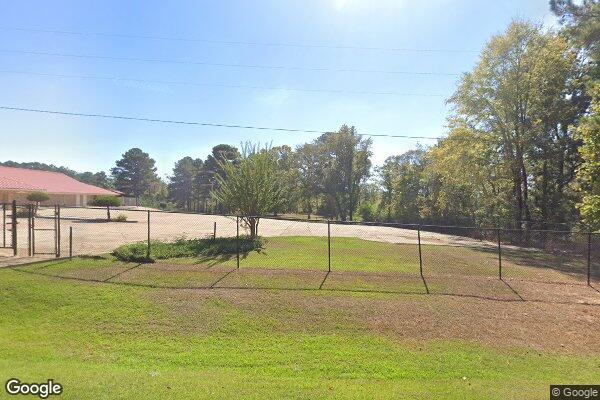
170 Timberlawn Rd
5 properties
View income and AMI reference data for greenwood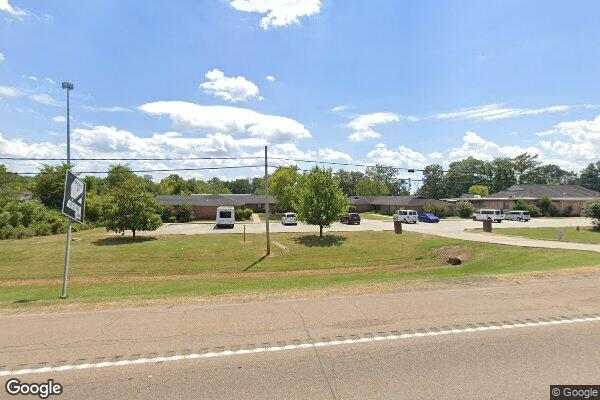
2714 HIGHWAY 82 E
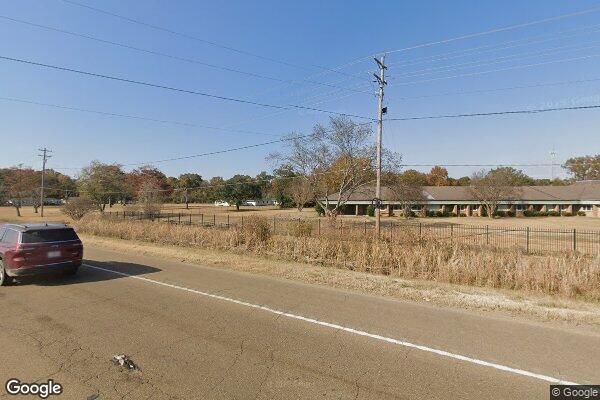
2800 Highway 82 E

1307 Plantation Dr
2504 Old Browning Road
907 Gordon St
5 properties
View income and AMI reference data for vicksburg
910 BOWMAN ST
2721 ALCORN DR
1309 MISSION 66 ST
3440 WISCONSIN AVE
3444 Wisconsin Ave
5 properties
View income and AMI reference data for hattiesburg
85 Jackson Wood Ct
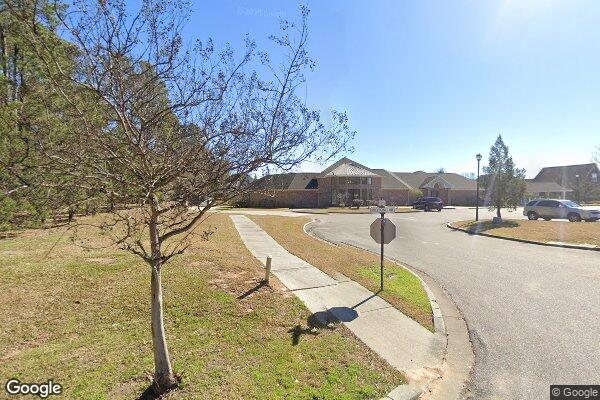
85 Jacksonwood Ct
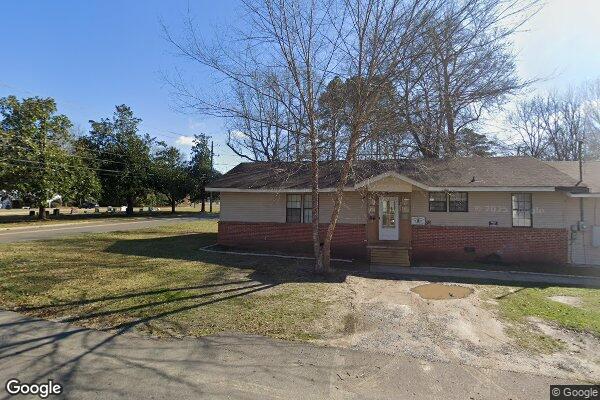
1000 W 7TH ST
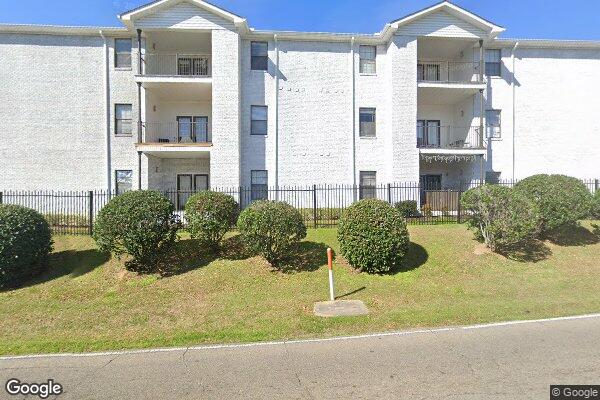
311 WESTOVER DR
20 Saint Claire Pkwy
4 properties
View income and AMI reference data for gulfport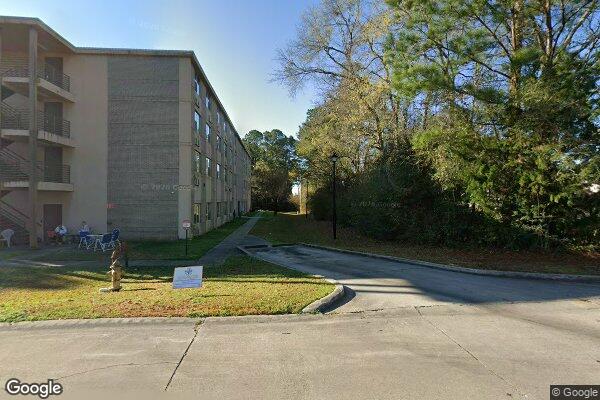
15195 BARBARA DR
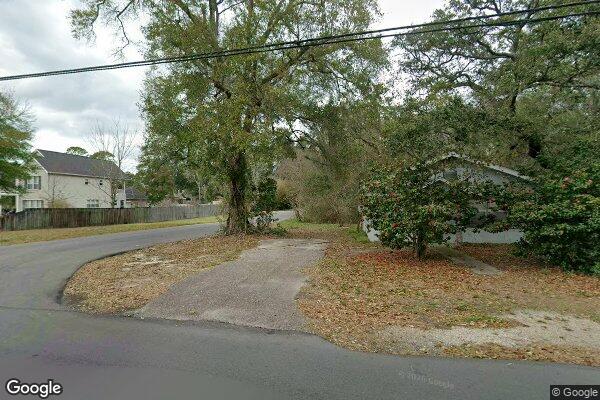
480 CHESHIRE DR
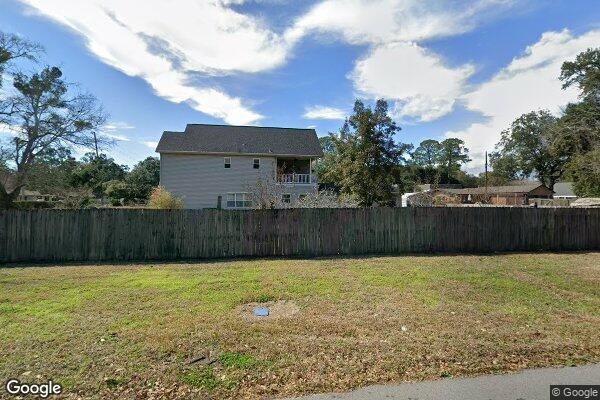
470 Cheshire DR
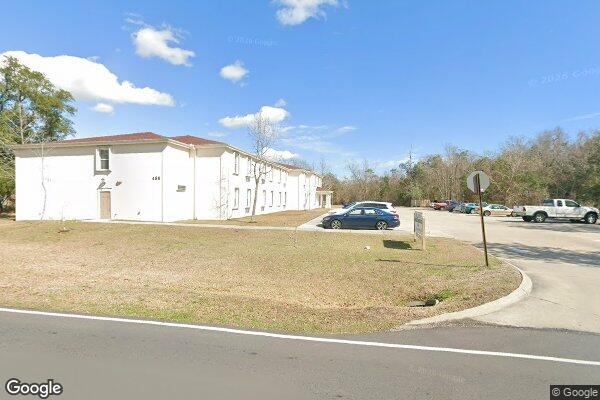
488 Teagarden Road
4 properties
View income and AMI reference data for yazoo city
2311 Gordon Ave
1095 CALHOUN AVE
203 E NINTH ST
725-A RIVER ROAD
HUD Small Area Fair Market Rents (SAFMR) are rental benchmarks used in housing programs; they do not set each voucher household's payment standard across Mississippi (MS). Across 59 HUD FMR areas and 64 listed communities in Mississippi (816 LIHTC tax credit, 203 Project-Based Section 8, 118 Section 202 senior, 447 USDA Rural Development), the property-location-weighted Fair Market Rent summary is $846/month for a 1-bedroom and $996/month for a 2-bedroom. Local Public Housing Agencies set their own voucher payment standards. The 90%–110% figures below are illustrative calculations from FMR, not guaranteed or official local payment standards.
| Unit Size | Illustrative 90% of FMR | Property-location-weighted FMR | Illustrative 110% of FMR | MS ZIP FMR Range (Min – Max) |
|---|---|---|---|---|
| Studio / Efficiency | $729/mo | $809/mo | $890/mo | $580 – $1,410/mo |
| 1 Bedroom | $762/mo | $846/mo | $931/mo | $640 – $1,530/mo |
| 2 Bedroom | $896/mo | $996/mo | $1,095/mo | $840 – $1,690/mo |
| 3 Bedroom | $1,139/mo | $1,265/mo | $1,392/mo | $1,010 – $2,230/mo |
| 4 Bedroom | $1,258/mo | $1,397/mo | $1,537/mo | $1,120 – $2,600/mo |
Source: HUD Small Area Fair Market Rents (SAFMR). Geography: property ZIP-code locations in Mississippi. Dataset year: not recorded in the local FMR table. The 90% and 110% columns are illustrative calculations; local PHAs set their own voucher payment standards.
| HUD Metro / FMR Area | Studio | 1 BR | 2 BR | 3 BR | 4 BR | HUD 4-Person Median Family Income | HUD fiscal year | Properties |
|---|---|---|---|---|---|---|---|---|
| Jackson, MS HUD Metro FMR Area32 ZIPs | $928 | $938 | $1,101 | $1,326 | $1,462 | $72,240 | FY2026 | 293 |
| Gulfport-Biloxi, MS HUD Metro FMR Area14 ZIPs | $787 | $904 | $1,106 | $1,432 | $1,565 | $78,793 | FY2026 | 96 |
| Hattiesburg, MS MSA10 ZIPs | $781 | $876 | $1,047 | $1,343 | $1,392 | $73,130 | FY2026 | 68 |
| Bolivar County, MS14 ZIPs | $683 | $702 | $881 | $1,170 | $1,279 | $48,994 | FY2026 | 62 |
| Carroll County, MS4 ZIPs | $672 | $687 | $865 | $1,075 | $1,200 | $64,575 | FY2026 | 52 |
| Memphis, TN-MS-AR HUD Metro FMR Area7 ZIPs | $1,119 | $1,208 | $1,362 | $1,774 | $2,102 | $87,558 | FY2026 | 30 |
| Benton County, MS HUD Metro FMR Area5 ZIPs | $776 | $803 | $955 | $1,210 | $1,440 | $62,645 | FY2026 | 28 |
| Lafayette County, MS3 ZIPs | $1,021 | $1,026 | $1,210 | $1,510 | $1,615 | $85,891 | FY2026 | 27 |
| Lee County, MS4 ZIPs | $858 | $866 | $1,009 | $1,277 | $1,349 | $84,993 | FY2026 | 26 |
| Clarke County, MS8 ZIPs | $774 | $802 | $896 | $1,170 | $1,241 | $52,303 | FY2026 | 25 |
| Calhoun County, MS7 ZIPs | $788 | $790 | $969 | $1,284 | $1,416 | $65,182 | FY2026 | 25 |
| Holmes County, MS HUD Metro FMR Area6 ZIPs | $776 | $813 | $915 | $1,187 | $1,253 | $54,973 | FY2026 | 24 |
Source: HUD User Income Limits and HUD SAFMR. Each row is a HUD area represented by listed property locations; the displayed HUD fiscal year is the latest available for that area. HUD income limits are reference data and do not establish official LIHTC/MTSP limits.
| Property-Location-Weighted Indicator | Mississippi Property-Location Summary |
|---|---|
| Median gross rent (U.S. Census ACS) | $820/mo |
| Property-location-weighted 2-Bedroom HUD Fair Market Rent (SAFMR) | $996/mo |
| Estimated property-location-weighted 4-person income benchmark | $61,085/yr |
| Median household income (Census ACS) | $45,761/yr |
| Renter-occupied housing share | 37.7% |
| Cost-burdened renters (spending 30%+ of income on rent) | 51.6% |
| Severely cost-burdened renters (spending 50%+ of income on rent) | 26.4% |
Source: U.S. Census ACS 5-year ZIP-code data and HUD SAFMR. Geography: ZIP-code locations represented by listed properties in Mississippi. Dataset year: not recorded or mixed in the local data. The summary is property-location-weighted and is not an official statewide qualification limit.
Methodology: Fair Market Rent benchmarks are summarized from HUD Small Area Fair Market Rents (SAFMR), HUD income limits by their latest available fiscal year, and U.S. Census ACS 5-year ZIP-code estimates across represented property locations in Mississippi. The local dataset does not record an FMR year. Local Public Housing Agencies (PHAs) establish their own payment standards; the 90%–110% figures are illustrative calculations only.