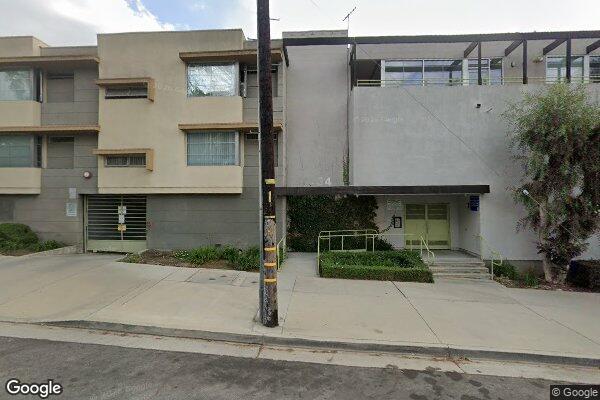
Allesandro Street Apartments
1934 Allesandro St
Income Based
Calculated by HUD
Seniors 62+18 Units
View Property
Browse 281 property records identified in HUD data with Section 811 indicators in California. Confirm current assistance and property-specific requirements directly.
HUD source-data date: not recorded. Data compilation and directory sync dates are not the HUD observation date.
Sources: HUD, USDA Rural Development, HUD LIHTC Database. See HUD's multifamily program descriptions and Section 811 program page.
This preliminary check is not an eligibility decision. Confirm rules with the administering agency.
HUD Section 811 has distinct capital-advance/PRAC and state-administered PRA approaches. Income targets, disability criteria, referrals, rent calculations, accessibility, services, and application processes can vary. A source-data indicator does not prove assistance is currently active. Confirm the program model and requirements with the property or its administering agency; see HUD's Section 811 program information.
53 properties
View income and AMI reference data for los angeles1934 Allesandro St
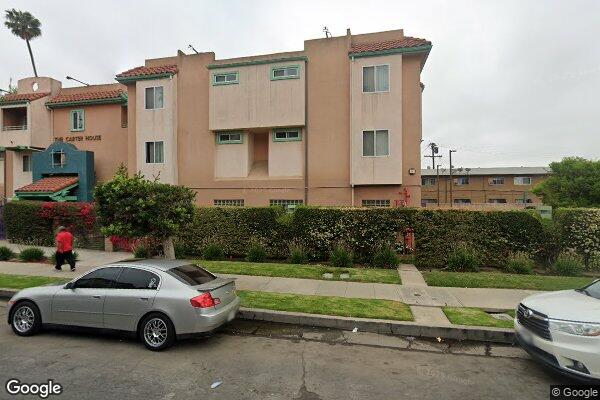
449 W 78TH ST
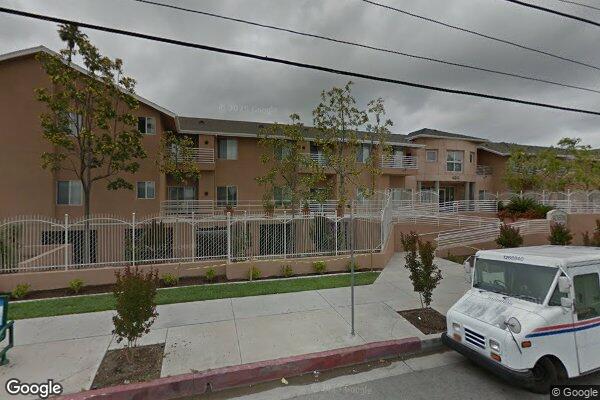
6202-6224 S. HOOVER
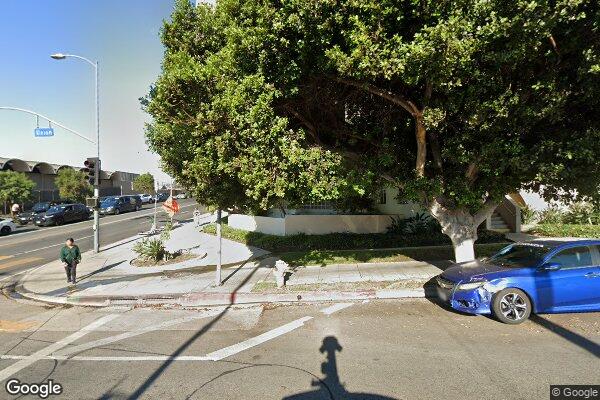
1711 W 3rd St
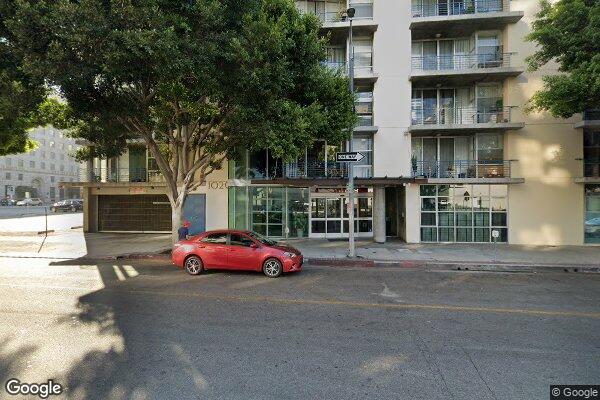
1020 S Flower ST
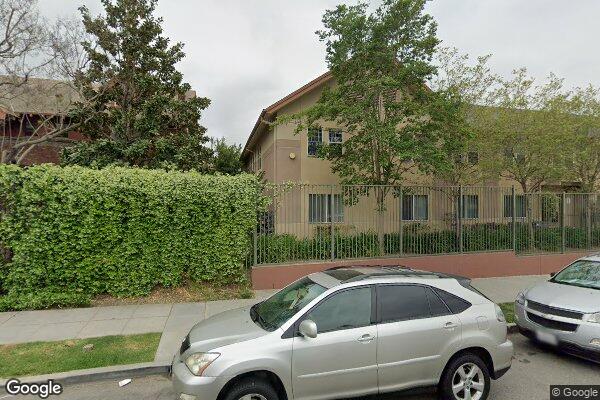
1660 ROCKWOOD ST
40 properties
View income and AMI reference data for san francisco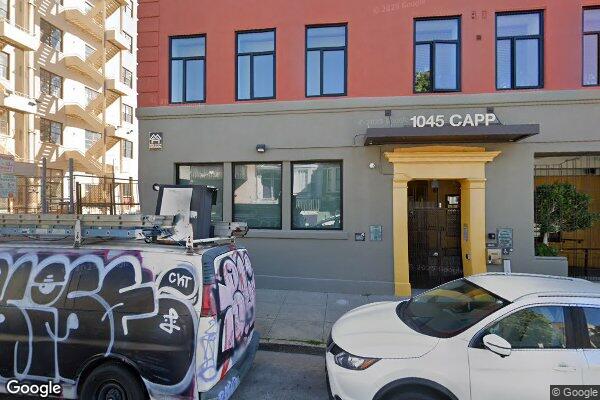
1045 CAPP STREET
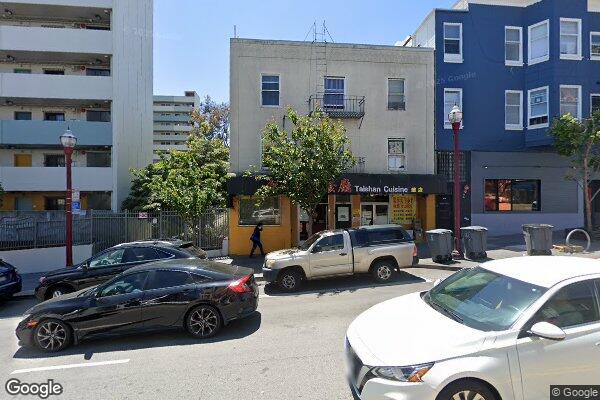
777 BROADWAY STREET
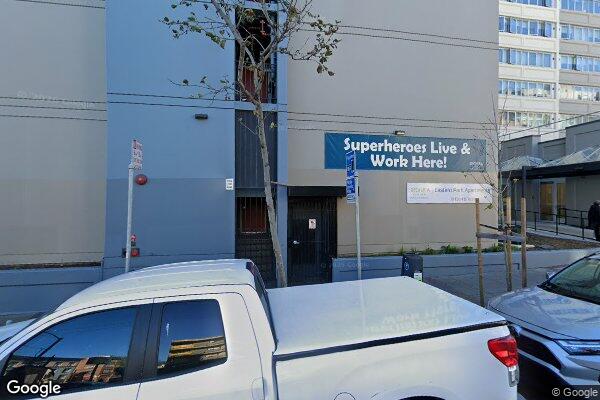
711 EDDY STREET
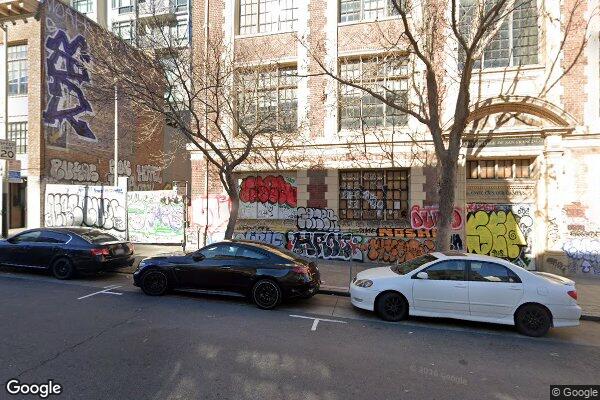
711 EDDY ST
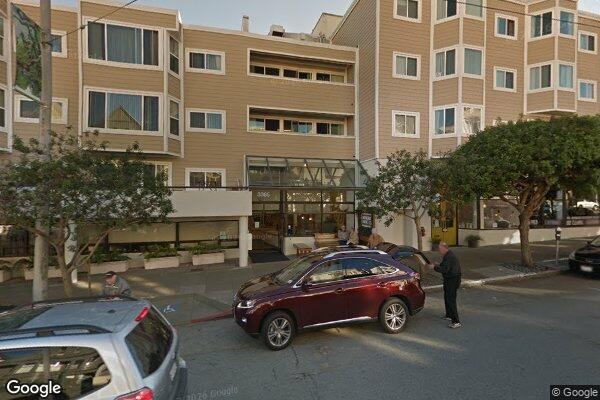
3365 SACRAMENTO ST
tbd
16 properties
View income and AMI reference data for oakland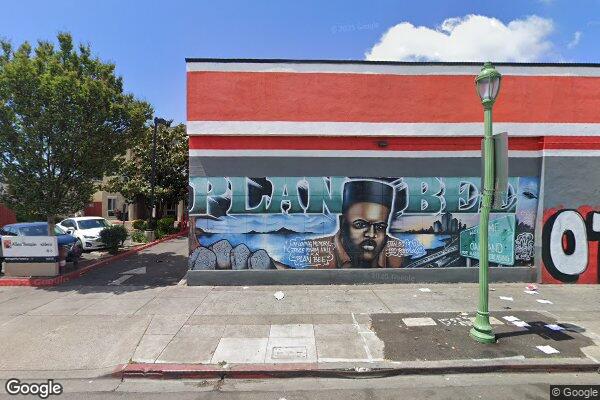
10121 E 14TH ST
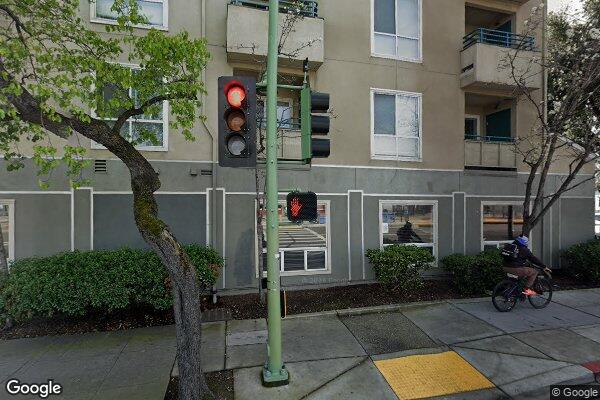
7607 INTERNATIONAL BOULEVARD
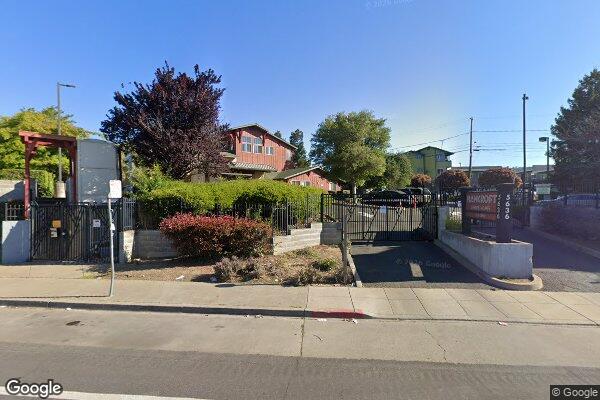
5636 Bancroft Avenue
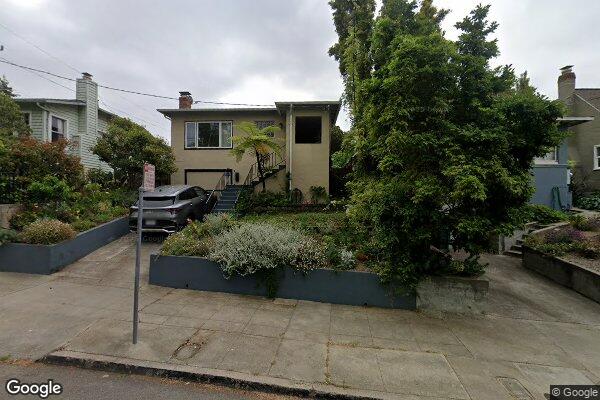
3850 COOLIDGE AVENUE
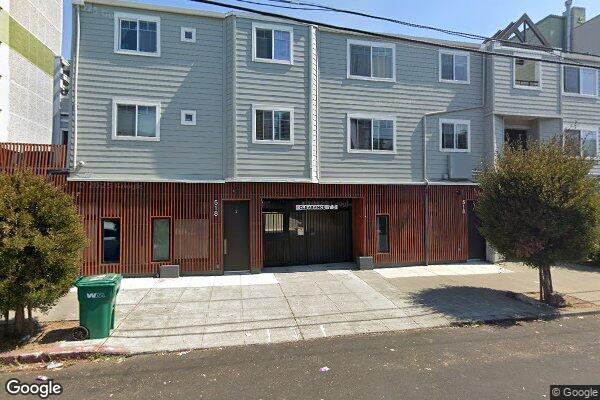
550 24th ST
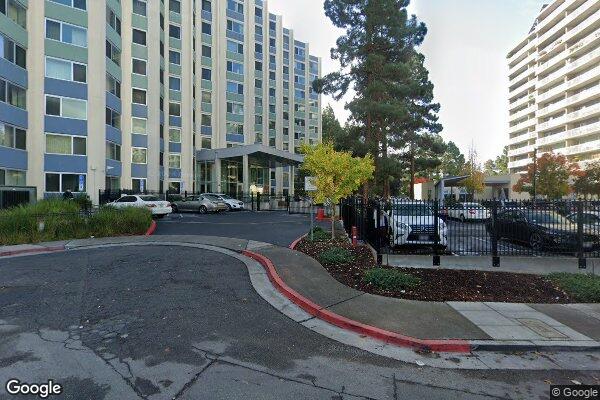
251 28TH ST
15 properties
View income and AMI reference data for pasadena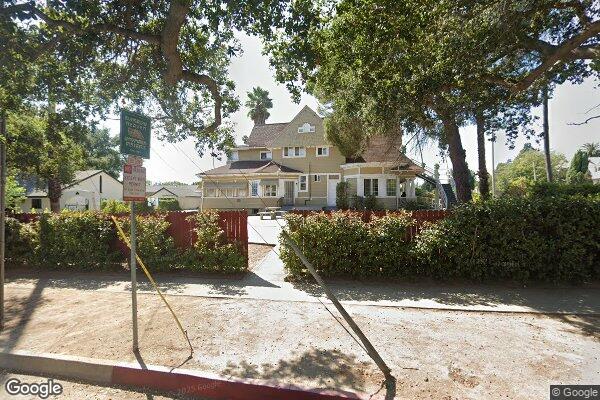
1115 North Chester Avenue
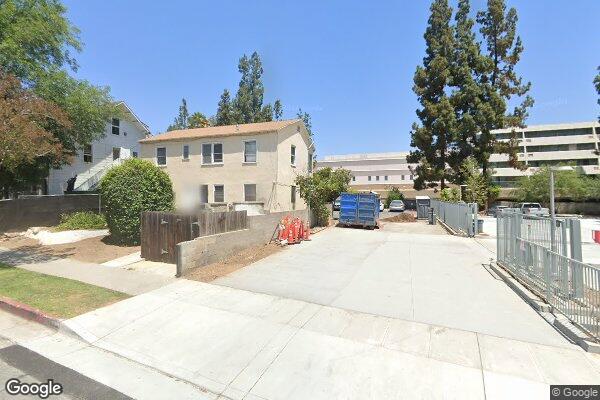
275 E. Cordova St
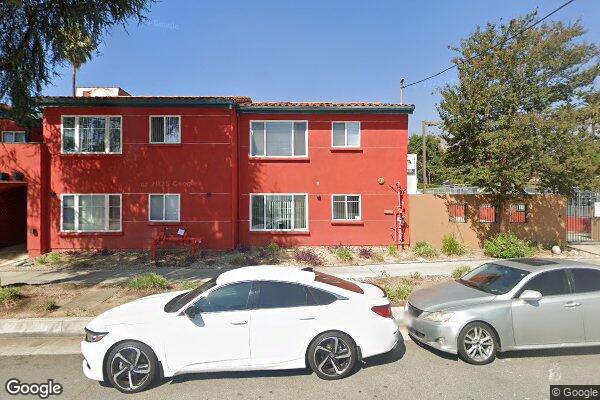
915 E Rio Grande St
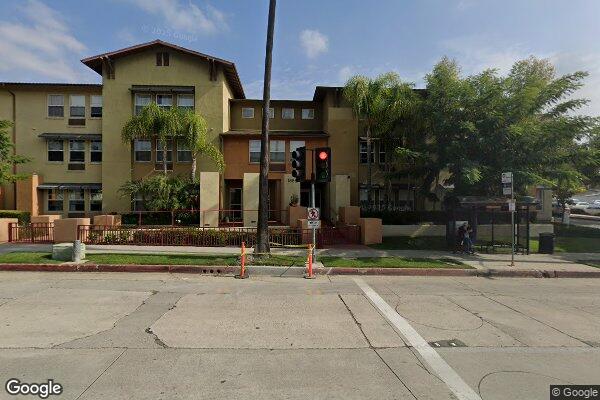
1888 N Fair Oaks Ave
42 E. WALNUT ST
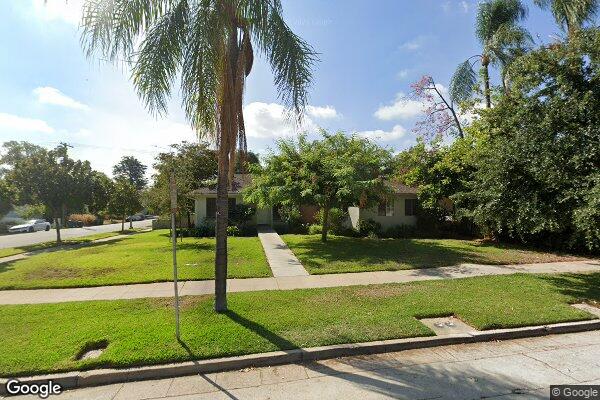
1920 E VILLA ST
13 properties
View income and AMI reference data for san jose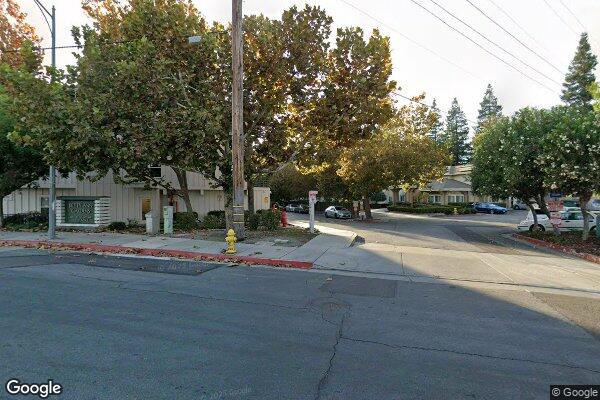
967 Lundy Avenue
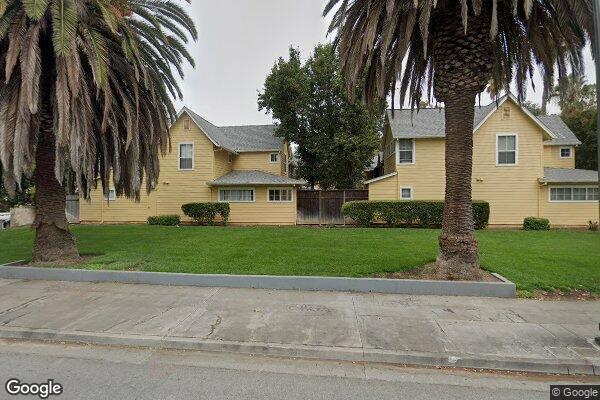
5340 Monterey Hwy
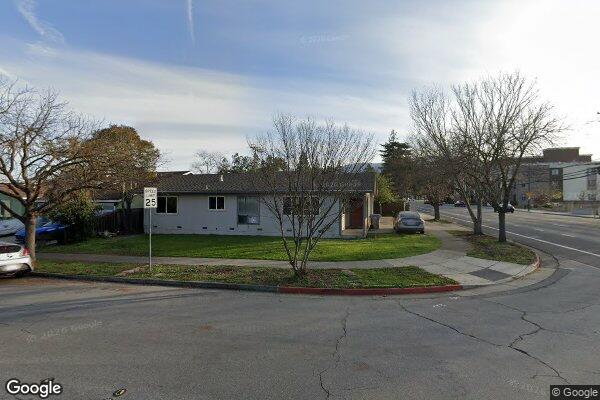
5030 Union AVE
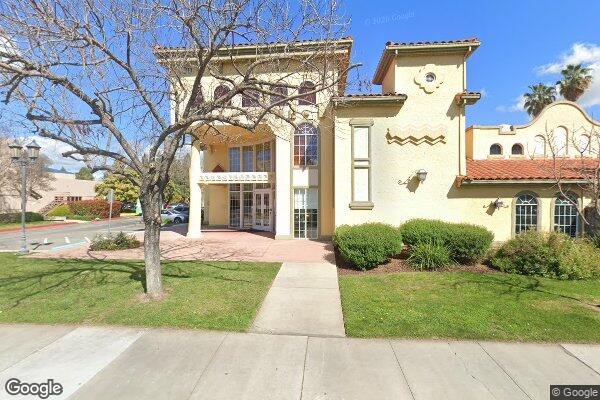
132 N. JACKSON AVE
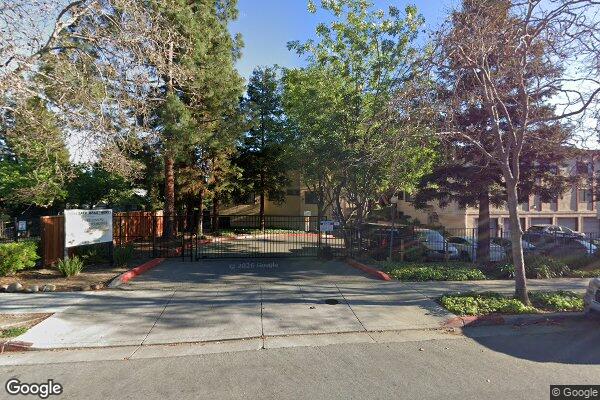
2850 ROSE AVE
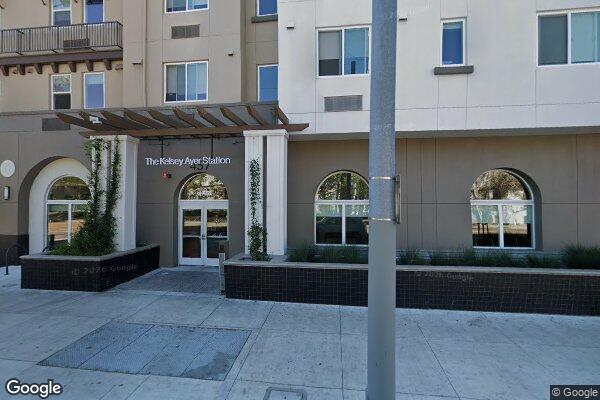
457 N 1ST STREET
10 properties
View income and AMI reference data for san diego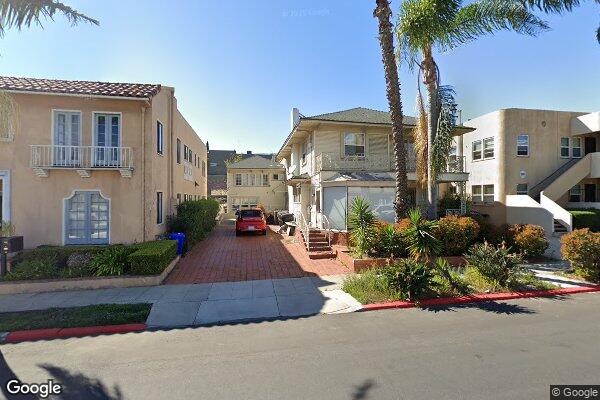
3360 4th Avenue
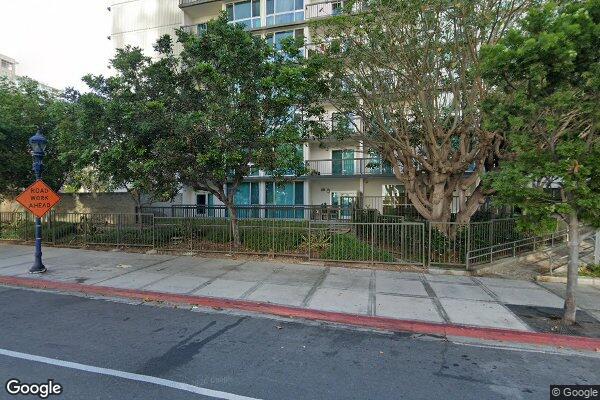
1055 9TH AVENUE
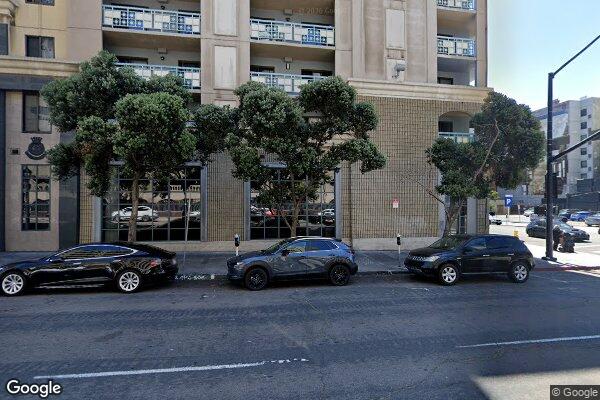
727 E St
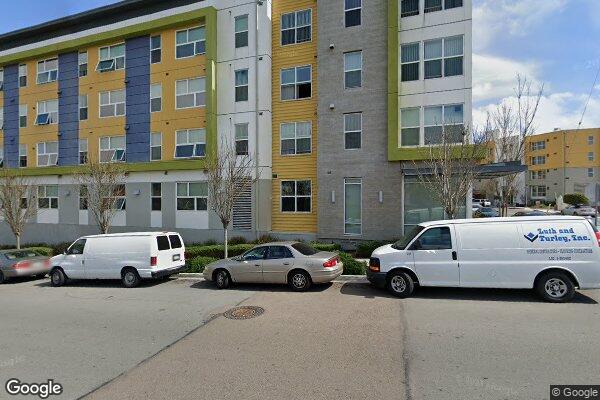
690 BEARDSLEY STREET
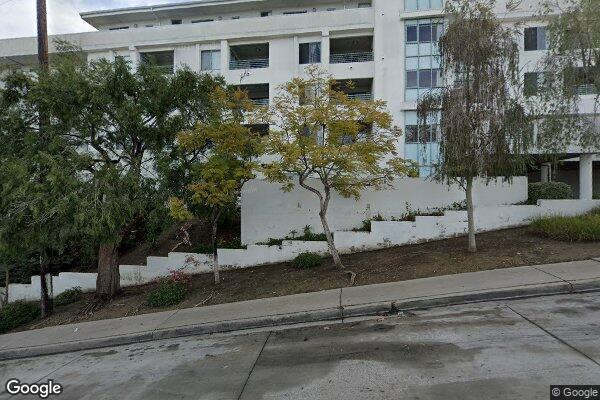
4227 52 St.
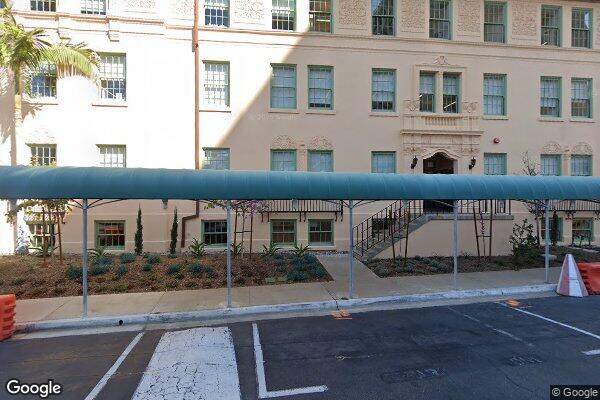
540 Lewis St
HUD Small Area Fair Market Rents (SAFMR) are rental benchmarks used in housing programs; they do not set each voucher household's payment standard across California (CA). Across 49 HUD FMR areas and 281 listed communities in California (5,101 LIHTC tax credit, 1,221 Project-Based Section 8, 721 Section 202 senior, 513 USDA Rural Development), the property-location-weighted Fair Market Rent summary is $2,110/month for a 1-bedroom and $2,599/month for a 2-bedroom. Local Public Housing Agencies set their own voucher payment standards. The 90%–110% figures below are illustrative calculations from FMR, not guaranteed or official local payment standards.
| Unit Size | Illustrative 90% of FMR | Property-location-weighted FMR | Illustrative 110% of FMR | CA ZIP FMR Range (Min – Max) |
|---|---|---|---|---|
| Studio / Efficiency | $1,731/mo | $1,924/mo | $2,116/mo | $740 – $3,950/mo |
| 1 Bedroom | $1,899/mo | $2,110/mo | $2,321/mo | $820 – $4,140/mo |
| 2 Bedroom | $2,339/mo | $2,599/mo | $2,858/mo | $1,070 – $5,230/mo |
| 3 Bedroom | $3,070/mo | $3,411/mo | $3,752/mo | $1,460 – $6,670/mo |
| 4 Bedroom | $3,502/mo | $3,892/mo | $4,281/mo | $1,540 – $7,720/mo |
Source: HUD Small Area Fair Market Rents (SAFMR). Geography: property ZIP-code locations in California. Dataset year: not recorded in the local FMR table. The 90% and 110% columns are illustrative calculations; local PHAs set their own voucher payment standards.
| HUD Metro / FMR Area | Studio | 1 BR | 2 BR | 3 BR | 4 BR | HUD 4-Person Median Family Income | HUD fiscal year | Properties |
|---|---|---|---|---|---|---|---|---|
| Los Angeles-Long Beach-Glendale, CA HUD Metro FMR Area215 ZIPs | $2,057 | $2,301 | $2,867 | $3,641 | $4,061 | $118,826 | FY2026 | 1,506 |
| Oakland-Fremont, CA HUD Metro FMR Area69 ZIPs | $2,099 | $2,347 | $2,863 | $3,660 | $4,341 | $165,195 | FY2026 | 532 |
| San Francisco, CA HUD Metro FMR Area61 ZIPs | $2,398 | $2,889 | $3,481 | $4,431 | $4,623 | $191,664 | FY2026 | 423 |
| San Diego-Chula Vista-Carlsbad, CA MSA58 ZIPs | $2,390 | $2,568 | $3,134 | $4,175 | $5,060 | $130,546 | FY2026 | 403 |
| Riverside-San Bernardino-Ontario, CA MSA82 ZIPs | $1,734 | $1,816 | $2,255 | $2,998 | $3,632 | $97,585 | FY2026 | 397 |
| San Jose-Sunnyvale-Santa Clara, CA HUD Metro FMR Area47 ZIPs | $2,479 | $2,808 | $3,292 | $4,352 | $4,734 | $191,327 | FY2026 | 360 |
| Sacramento--Roseville--Arden-Arcade, CA HUD Metro FMR Area57 ZIPs | $1,792 | $1,878 | $2,315 | $3,086 | $3,562 | $123,071 | FY2026 | 342 |
| Fresno, CA HUD Metro FMR Area38 ZIPs | $1,263 | $1,274 | $1,568 | $2,177 | $2,505 | $83,008 | FY2026 | 257 |
| Santa Ana-Anaheim-Irvine, CA HUD Metro FMR Area62 ZIPs | $2,628 | $2,692 | $3,173 | $4,307 | $5,143 | $146,648 | FY2026 | 238 |
| Bakersfield-Delano, CA MSA26 ZIPs | $1,116 | $1,138 | $1,469 | $2,022 | $2,416 | $72,991 | FY2026 | 200 |
| Oxnard-Thousand Oaks-Ventura, CA MSA17 ZIPs | $1,975 | $2,222 | $2,653 | $3,591 | $4,166 | $125,016 | FY2026 | 124 |
| Salinas, CA MSA16 ZIPs | $2,300 | $2,369 | $2,880 | $3,839 | $4,151 | $109,578 | FY2026 | 116 |
Source: HUD User Income Limits and HUD SAFMR. Each row is a HUD area represented by listed property locations; the displayed HUD fiscal year is the latest available for that area. HUD income limits are reference data and do not establish official LIHTC/MTSP limits.
| Property-Location-Weighted Indicator | California Property-Location Summary |
|---|---|
| Median gross rent (U.S. Census ACS) | $1,813/mo |
| Property-location-weighted 2-Bedroom HUD Fair Market Rent (SAFMR) | $2,599/mo |
| Estimated property-location-weighted 4-person income benchmark | $105,759/yr |
| Median household income (Census ACS) | $87,946/yr |
| Renter-occupied housing share | 51.8% |
| Cost-burdened renters (spending 30%+ of income on rent) | 54.9% |
| Severely cost-burdened renters (spending 50%+ of income on rent) | 28.2% |
Source: U.S. Census ACS 5-year ZIP-code data and HUD SAFMR. Geography: ZIP-code locations represented by listed properties in California. Dataset year: not recorded or mixed in the local data. The summary is property-location-weighted and is not an official statewide qualification limit.
Methodology: Fair Market Rent benchmarks are summarized from HUD Small Area Fair Market Rents (SAFMR), HUD income limits by their latest available fiscal year, and U.S. Census ACS 5-year ZIP-code estimates across represented property locations in California. The local dataset does not record an FMR year. Local Public Housing Agencies (PHAs) establish their own payment standards; the 90%–110% figures are illustrative calculations only.