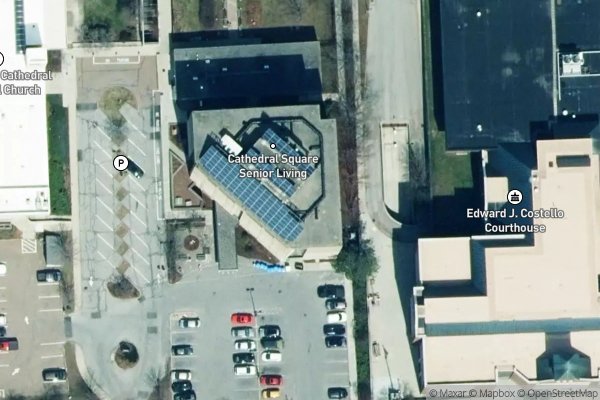
CATHEDRAL SQUARE SENIOR LIVING REDEVELOPMENT
3 CATHEDRAL SQ
Income Based
Calculated by HUD
Income-Based Rent107 Units
View Property
Browse 77 HUD Project-Based Section 8 housing properties across Vermont, organized by city. Tenants generally pay 30% of adjusted income toward rent and apply directly to the property management office—no portable voucher required.
Data compiled by the Find My Housing team · Last updated
Sources: HUD, USDA Rural Development, HUD LIHTC Database.
Answer 3 quick questions — no account required.
Section 8 housing in Vermont includes both HUD Project-Based Section 8 apartments (77 properties listed below) and tenant-based Housing Choice Vouchers. In Project-Based Section 8 communities, the federal rental subsidy is attached directly to the apartment building under 24 CFR Part 880, meaning qualifying residents pay approximately 30% of their monthly adjusted income toward rent and utilities without needing a portable voucher. To qualify in Vermont, household income must generally fall at or below 50% of the county Area Median Income (AMI)—with at least 40% of units reserved for households at or below 30% AMI—and net family assets must not exceed HUD's $105,574 HOTMA cap. Because each Vermont property manages its own waiting list independently of local Public Housing Agencies, contact multiple properties below to apply directly.
13 properties
View income and AMI reference data for burlington3 CATHEDRAL SQ
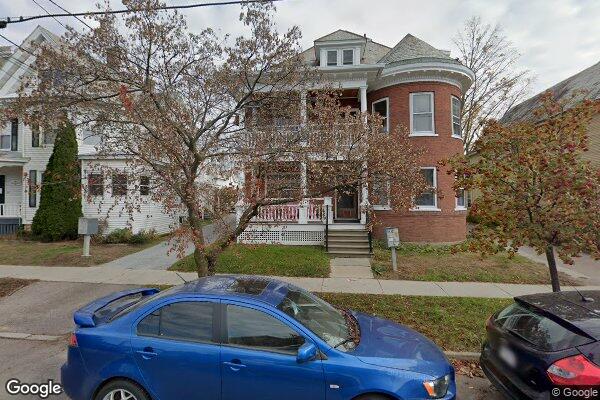
72 N Winooski Ave
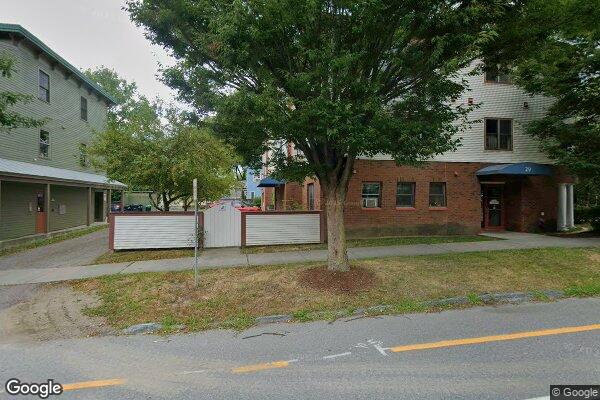
29 N Champlain St
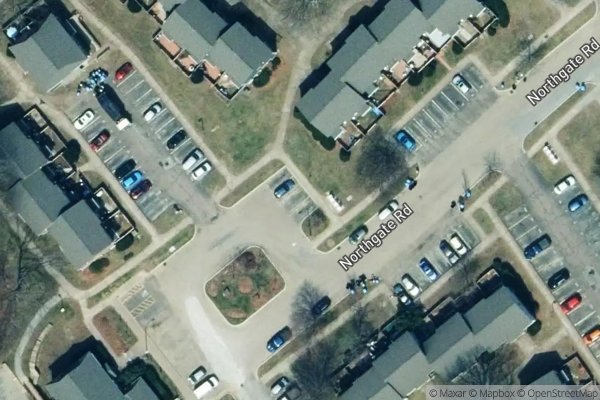
275 NORTHGATE RD
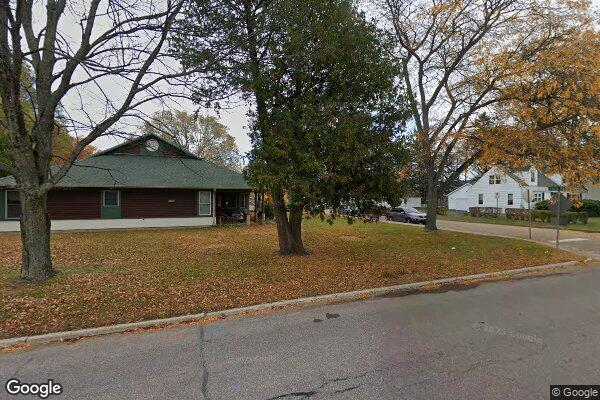
1822 NORTH AVE
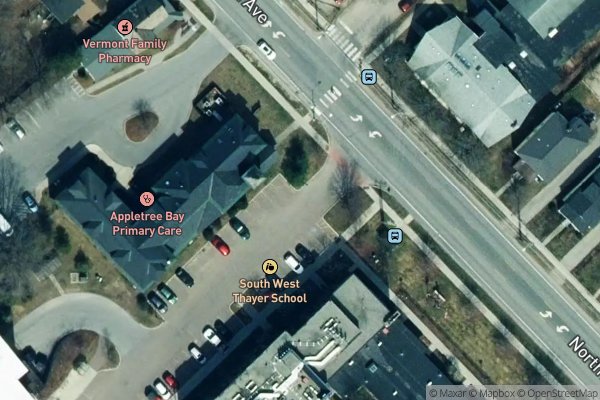
1197 N AVE
6 properties
View income and AMI reference data for newport
GOVERNOR PROUTY DRIVE
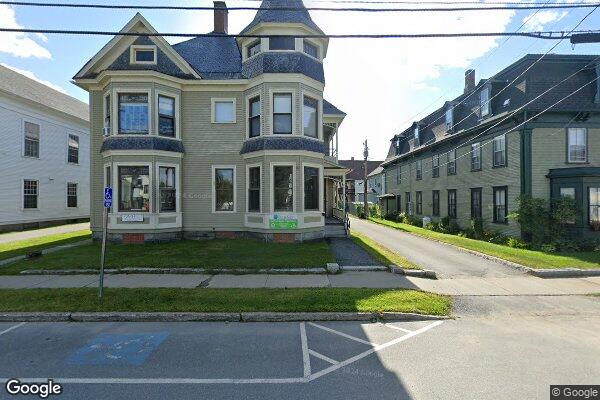
88 2nd St
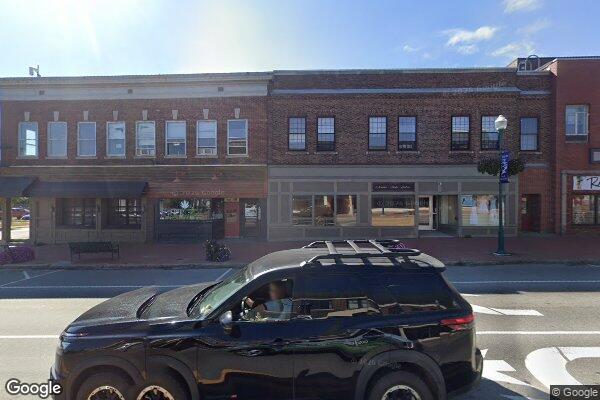
107-119 Main Street
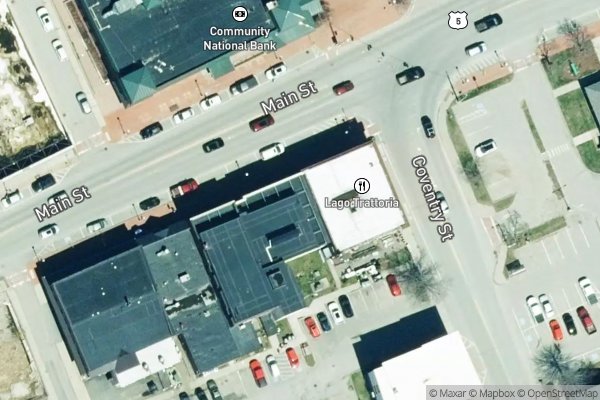
107 MAIN ST
143 WILLEY ST
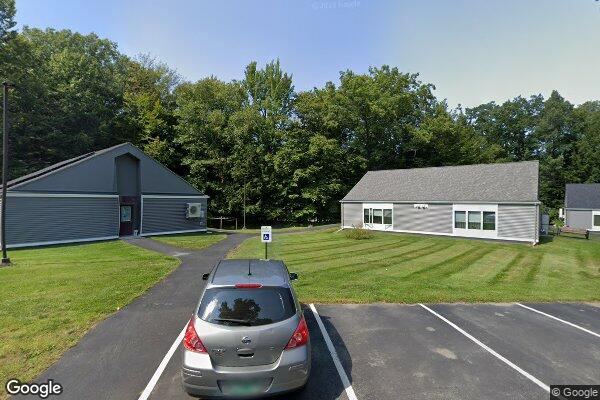
143 WILLEY ST
5 properties
View income and AMI reference data for hardwick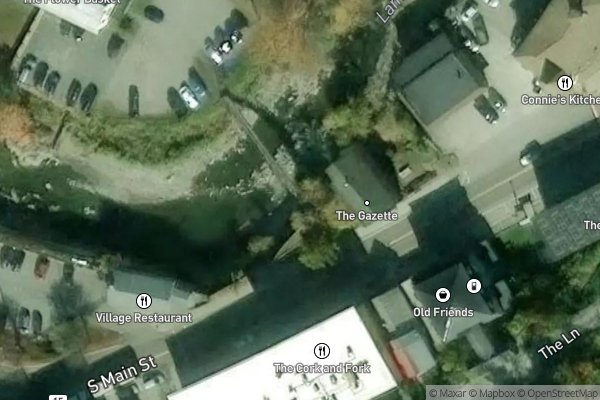
41 S MAIN ST
40 LOWER CHERRY ST
40 LOWER CHERRY ST
73 DALE ST
36 MAPLE ST
4 properties
View income and AMI reference data for montpelier
21 CUMMINGS ST
21 CUMMINGS ST
1 MECHANIC ST
7 St Paul St
4 properties
View income and AMI reference data for south burlington
412 FARRELL ST
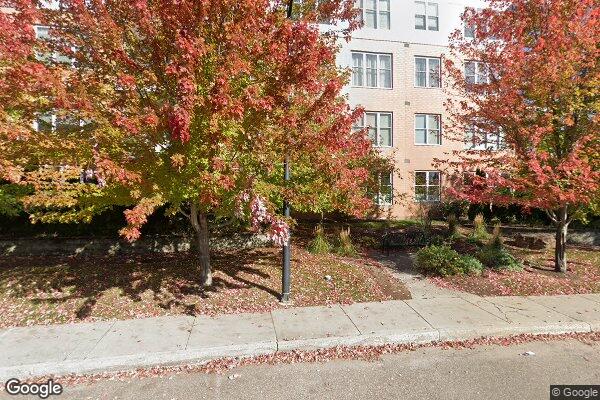
412 Farrell St
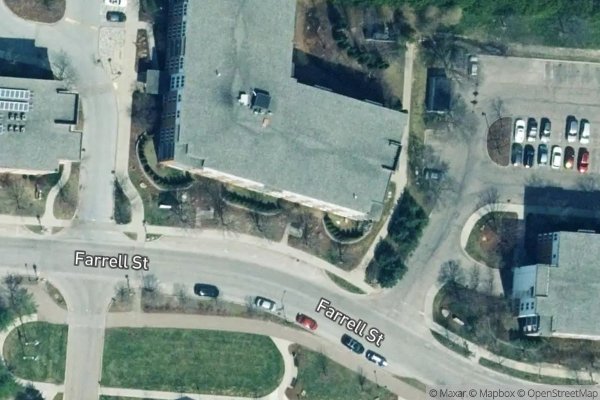
412 FARRELL ST
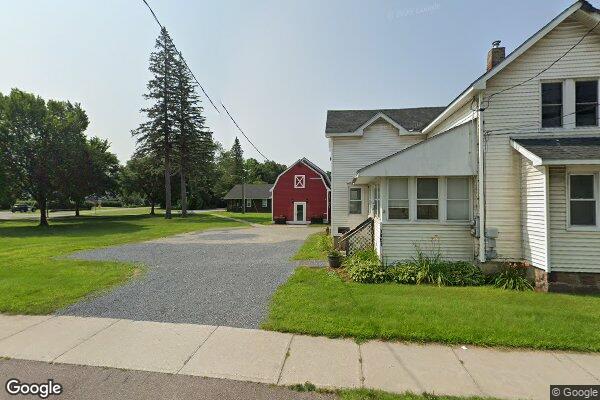
1451 Williston Rd
4 properties
View income and AMI reference data for rutland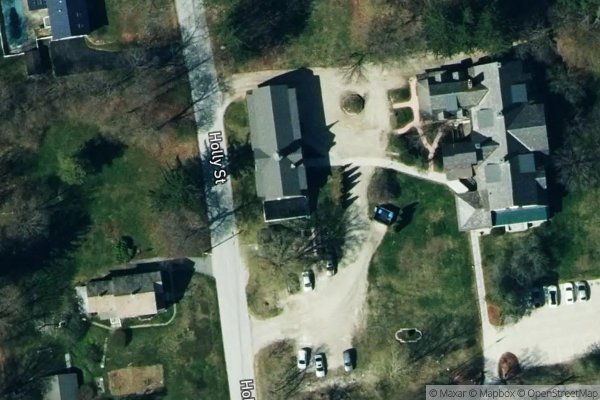
160 HOLLY ST
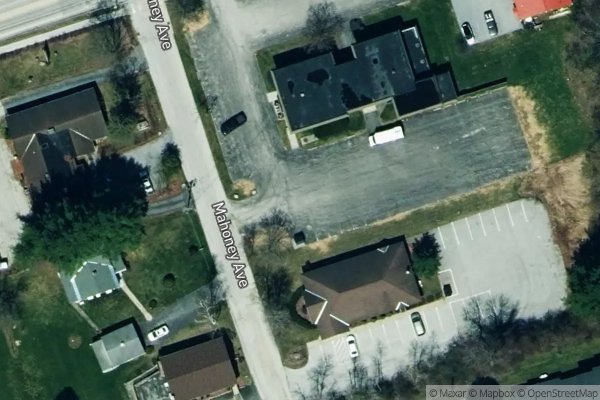
101 MAHONEY AVE
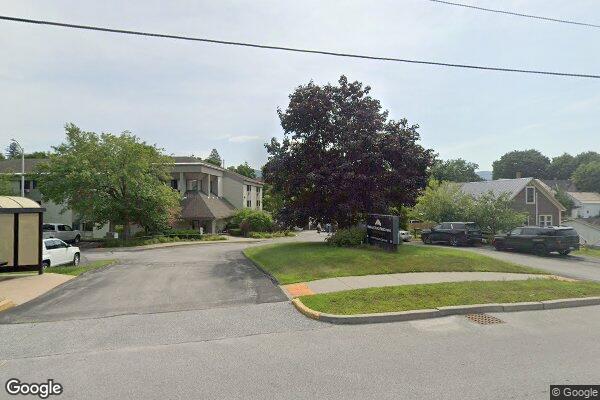
72 Pine St
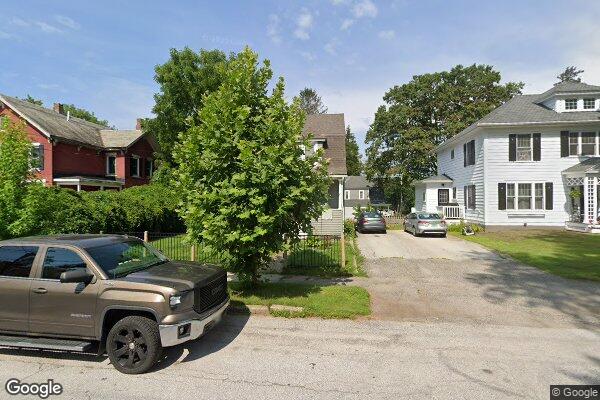
129 Church St
HUD Small Area Fair Market Rents (SAFMR) are rental benchmarks used in housing programs; they do not set each voucher household's payment standard across Vermont (VT). Across 12 HUD FMR areas and 77 listed communities in Vermont (344 LIHTC tax credit, 106 Project-Based Section 8, 38 Section 202 senior, 210 USDA Rural Development), the property-location-weighted Fair Market Rent summary is $1,303/month for a 1-bedroom and $1,639/month for a 2-bedroom. Local Public Housing Agencies set their own voucher payment standards. The 90%–110% figures below are illustrative calculations from FMR, not guaranteed or official local payment standards.
| Unit Size | Illustrative 90% of FMR | Property-location-weighted FMR | Illustrative 110% of FMR | VT ZIP FMR Range (Min – Max) |
|---|---|---|---|---|
| Studio / Efficiency | $1,104/mo | $1,226/mo | $1,349/mo | $820 – $1,710/mo |
| 1 Bedroom | $1,172/mo | $1,303/mo | $1,433/mo | $860 – $1,890/mo |
| 2 Bedroom | $1,475/mo | $1,639/mo | $1,803/mo | $1,030 – $2,450/mo |
| 3 Bedroom | $1,884/mo | $2,093/mo | $2,303/mo | $1,330 – $3,140/mo |
| 4 Bedroom | $2,048/mo | $2,275/mo | $2,503/mo | $1,590 – $3,240/mo |
Source: HUD Small Area Fair Market Rents (SAFMR). Geography: property ZIP-code locations in Vermont. Dataset year: not recorded in the local FMR table. The 90% and 110% columns are illustrative calculations; local PHAs set their own voucher payment standards.
| HUD Metro / FMR Area | Studio | 1 BR | 2 BR | 3 BR | 4 BR | HUD 4-Person Median Family Income | HUD fiscal year | Properties |
|---|---|---|---|---|---|---|---|---|
| Burlington-South Burlington, VT MSA23 ZIPs | $1,503 | $1,649 | $2,138 | $2,743 | $2,831 | $115,342 | FY2026 | 158 |
| Windham County, VT9 ZIPs | $1,092 | $1,162 | $1,419 | $1,725 | $1,886 | $95,970 | FY2026 | 54 |
| Caledonia County, VT13 ZIPs | $996 | $1,017 | $1,218 | $1,629 | $1,798 | $94,480 | FY2026 | 44 |
| Addison County, VT5 ZIPs | $1,126 | $1,135 | $1,458 | $1,781 | $2,148 | $101,740 | FY2026 | 37 |
| Windsor County, VT9 ZIPs | $1,208 | $1,216 | $1,427 | $1,869 | $1,934 | $105,836 | FY2026 | 32 |
| Rutland County, VT6 ZIPs | $1,008 | $1,016 | $1,332 | $1,626 | $1,971 | $96,428 | FY2026 | 30 |
| Orleans County, VT7 ZIPs | $1,016 | $1,078 | $1,285 | $1,656 | $2,156 | $87,935 | FY2026 | 25 |
| Orange County, VT10 ZIPs | $1,119 | $1,171 | $1,438 | $1,816 | $1,949 | $102,513 | FY2026 | 24 |
| Bennington County, VT6 ZIPs | $1,048 | $1,170 | $1,335 | $1,845 | $2,205 | $112,496 | FY2026 | 24 |
| Washington County, VT7 ZIPs | $1,222 | $1,232 | $1,613 | $1,983 | $2,137 | $115,726 | FY2026 | 23 |
| Lamoille County, VT3 ZIPs | $971 | $1,050 | $1,330 | $1,840 | $1,850 | $94,047 | FY2026 | 12 |
| Essex County, VT1 ZIP | $910 | $1,070 | $1,170 | $1,630 | $1,910 | $78,938 | FY2026 | 1 |
Source: HUD User Income Limits and HUD SAFMR. Each row is a HUD area represented by listed property locations; the displayed HUD fiscal year is the latest available for that area. HUD income limits are reference data and do not establish official LIHTC/MTSP limits.
| Property-Location-Weighted Indicator | Vermont Property-Location Summary |
|---|---|
| Median gross rent (U.S. Census ACS) | $1,189/mo |
| Property-location-weighted 2-Bedroom HUD Fair Market Rent (SAFMR) | $1,639/mo |
| Estimated property-location-weighted 4-person income benchmark | $104,939/yr |
| Median household income (Census ACS) | $73,871/yr |
| Renter-occupied housing share | 33% |
| Cost-burdened renters (spending 30%+ of income on rent) | 50.6% |
| Severely cost-burdened renters (spending 50%+ of income on rent) | 26% |
Source: U.S. Census ACS 5-year ZIP-code data and HUD SAFMR. Geography: ZIP-code locations represented by listed properties in Vermont. Dataset year: not recorded or mixed in the local data. The summary is property-location-weighted and is not an official statewide qualification limit.
Methodology: Fair Market Rent benchmarks are summarized from HUD Small Area Fair Market Rents (SAFMR), HUD income limits by their latest available fiscal year, and U.S. Census ACS 5-year ZIP-code estimates across represented property locations in Vermont. The local dataset does not record an FMR year. Local Public Housing Agencies (PHAs) establish their own payment standards; the 90%–110% figures are illustrative calculations only.