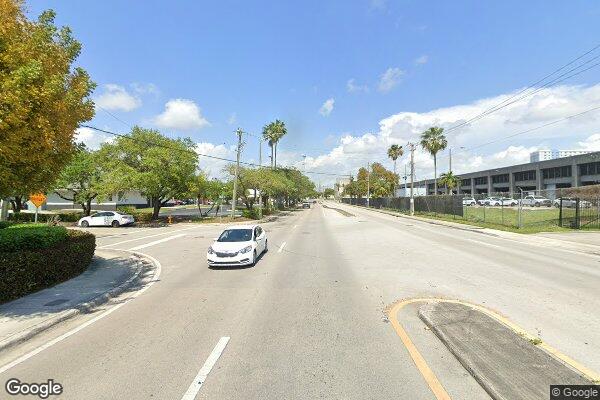
CIVIC TOWERS SENIOR
1400 NORTHWEST 19TH STREET
Income Based
Calculated by HUD
Income-Based Rent151 Units
View Property
Browse 260 HUD Project-Based Section 8 housing properties across Florida, organized by city. Tenants generally pay 30% of adjusted income toward rent and apply directly to the property management office—no portable voucher required.
Data compiled by the Find My Housing team · Last updated
Sources: HUD, USDA Rural Development, HUD LIHTC Database.
Answer 3 quick questions — no account required.
Section 8 housing in Florida includes both HUD Project-Based Section 8 apartments (260 properties listed below) and tenant-based Housing Choice Vouchers. In Project-Based Section 8 communities, the federal rental subsidy is attached directly to the apartment building under 24 CFR Part 880, meaning qualifying residents pay approximately 30% of their monthly adjusted income toward rent and utilities without needing a portable voucher. To qualify in Florida, household income must generally fall at or below 50% of the county Area Median Income (AMI)—with at least 40% of units reserved for households at or below 30% AMI—and net family assets must not exceed HUD's $105,574 HOTMA cap. Because each Florida property manages its own waiting list independently of local Public Housing Agencies, contact multiple properties below to apply directly.
36 properties
View income and AMI reference data for miami1400 NORTHWEST 19TH STREET
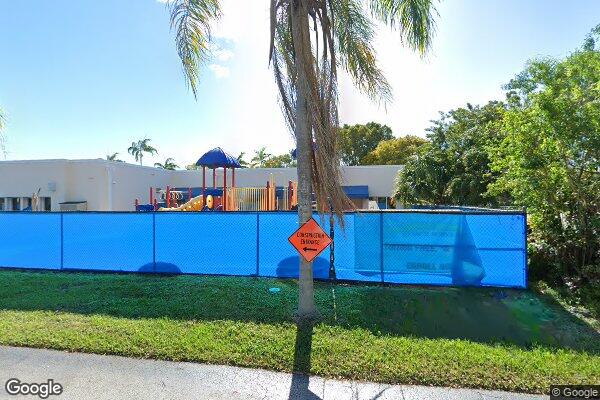
10905 SW 112TH AVE
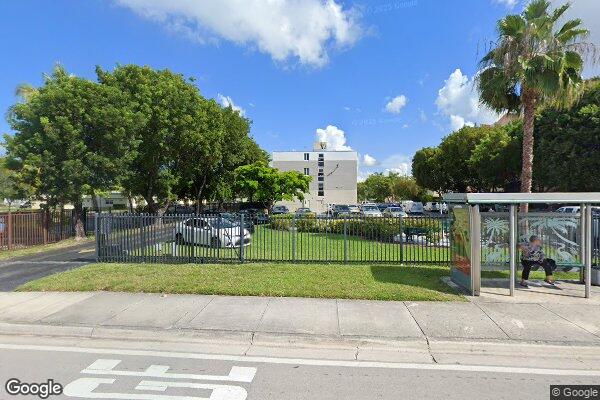
11495 W FLAGLER ST
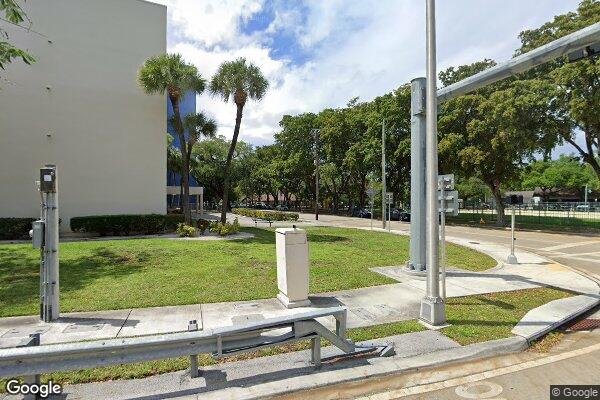
350 NW 2ND STREET
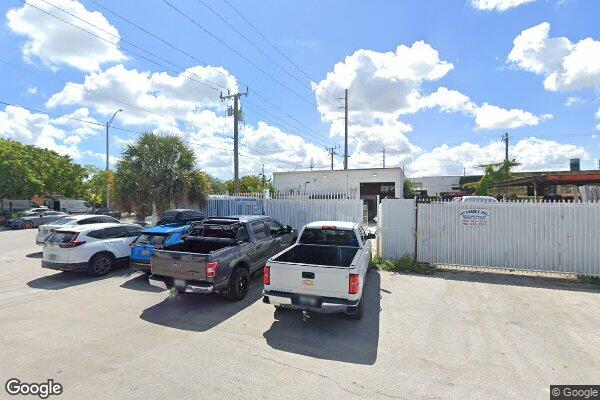
7981 NW 37th Ave
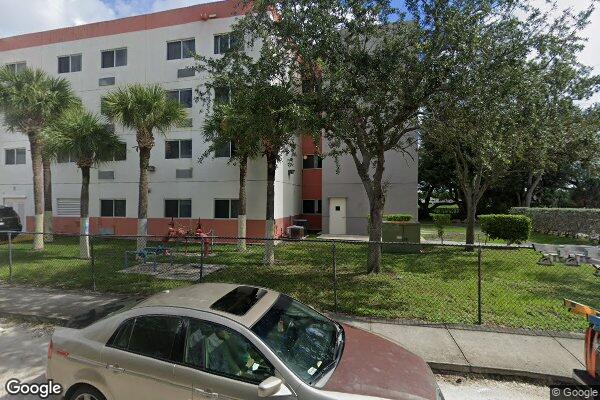
255 Sierra Dr
32 properties
View income and AMI reference data for jacksonville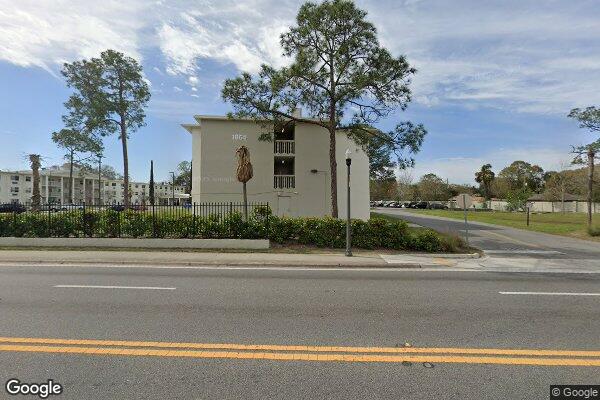
1850 KINGS ROAD
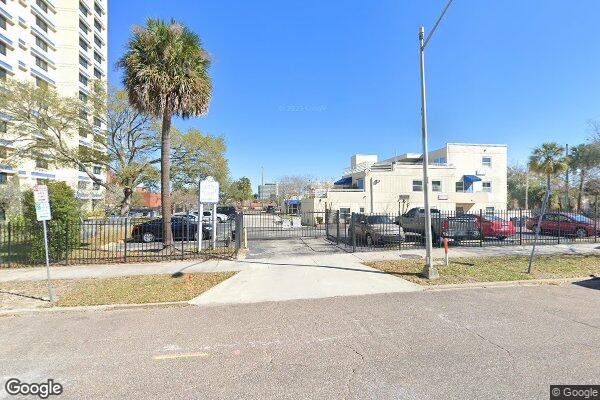
201 E Ashley St
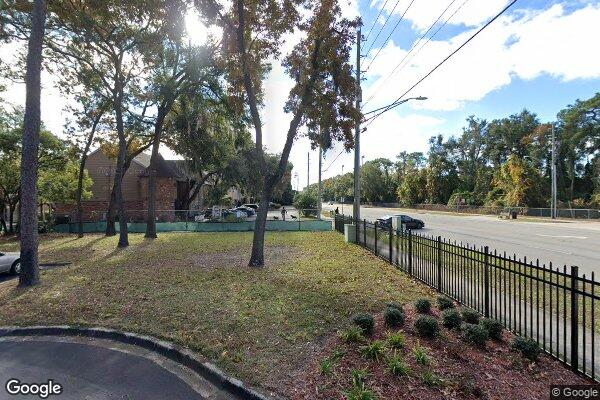
3333 University Blvd N
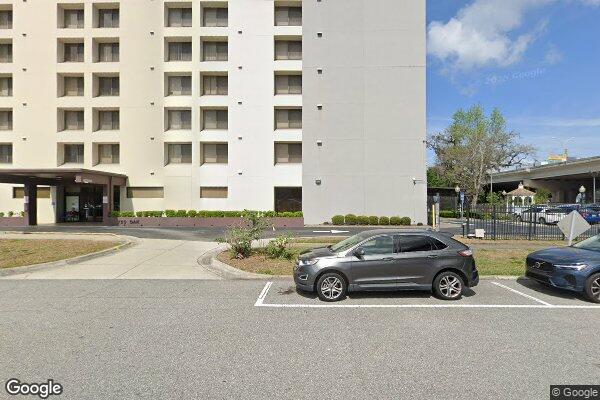
750 OAK ST
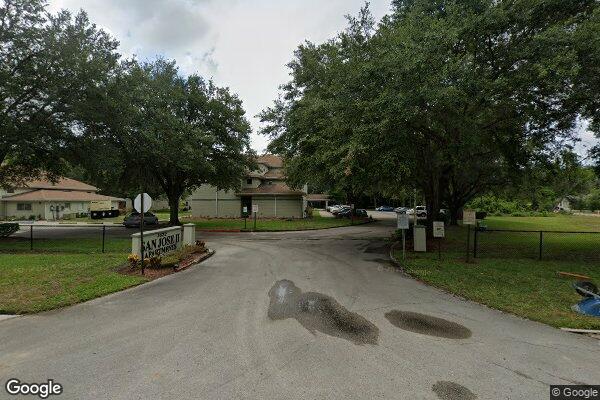
3622 Galicia Rd
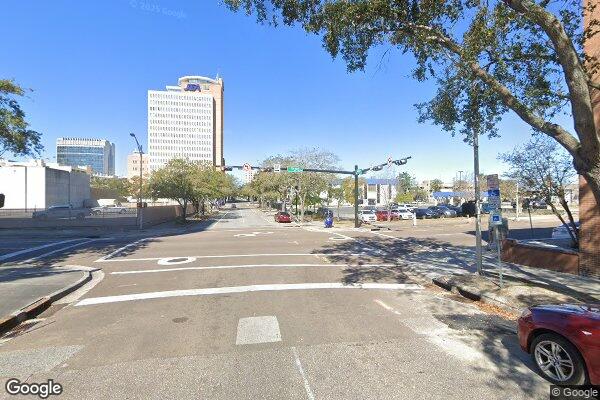
601 N. OCEAN STREET
29 properties
View income and AMI reference data for tampa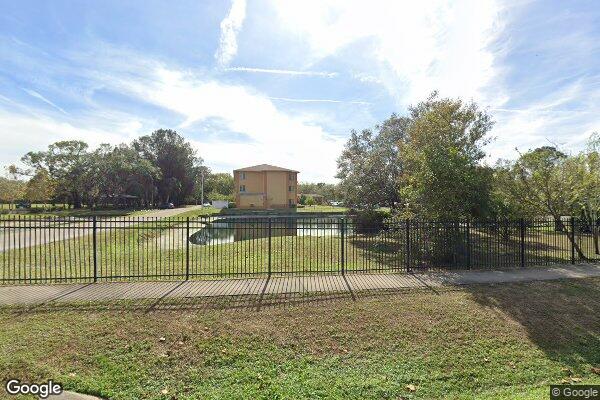
6801 12th Ave S
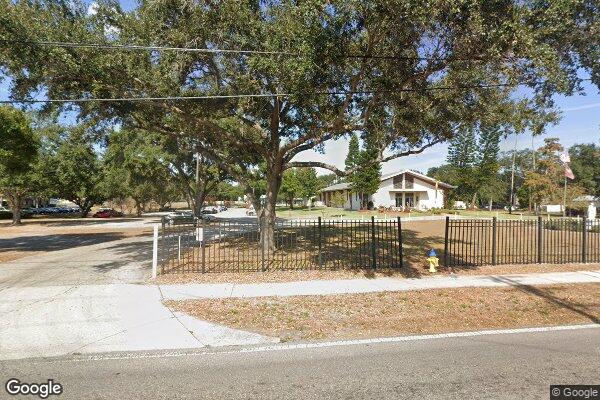
2508 E Hanna Ave
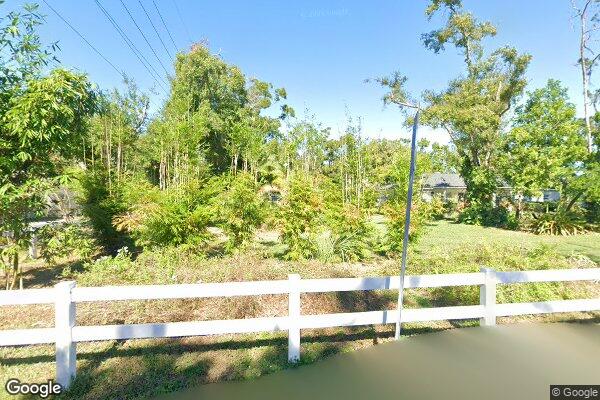
4125 N Lincoln Ave
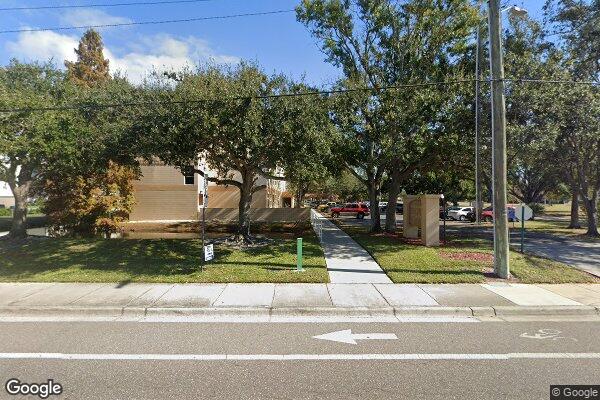
4514 S Manhattan Ave
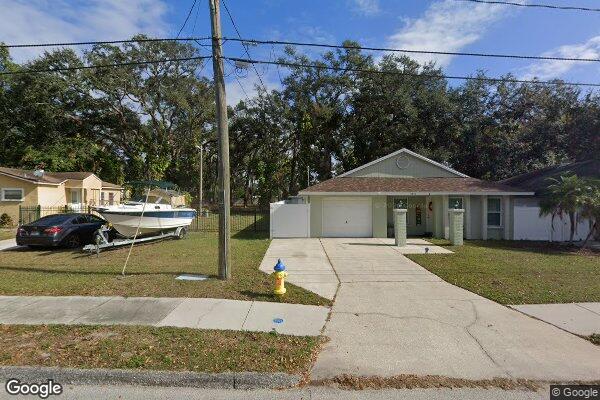
4815 N. MacDill Avenue
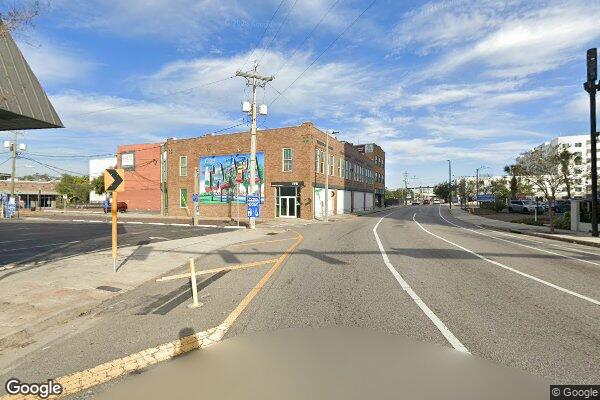
400 EAST HARRISON STREET
14 properties
View income and AMI reference data for orlando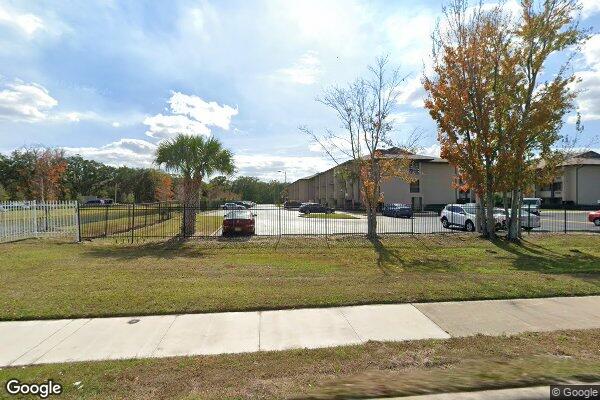
3850 W. D. Judge Drive
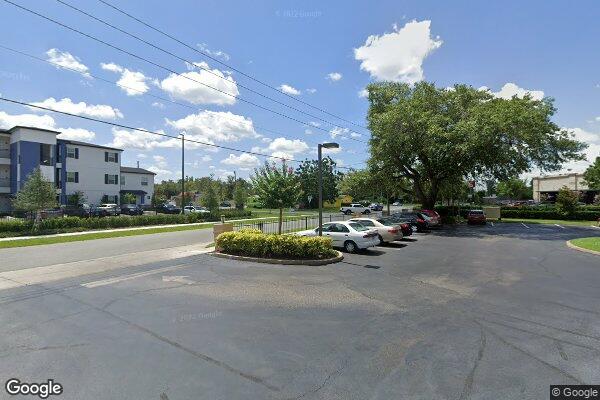
5200 EGGLESTON AVE
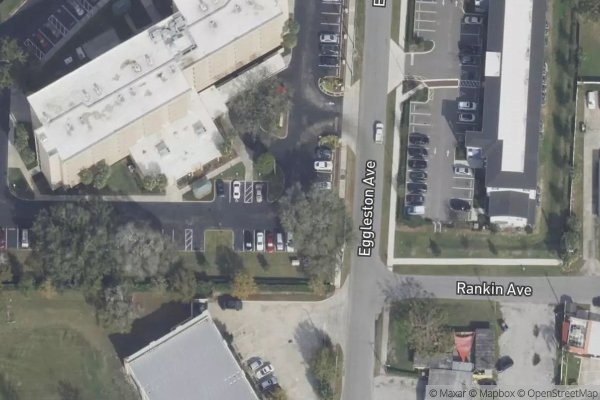
5212 Eggleston Ave
4381 CROSSROADS CT
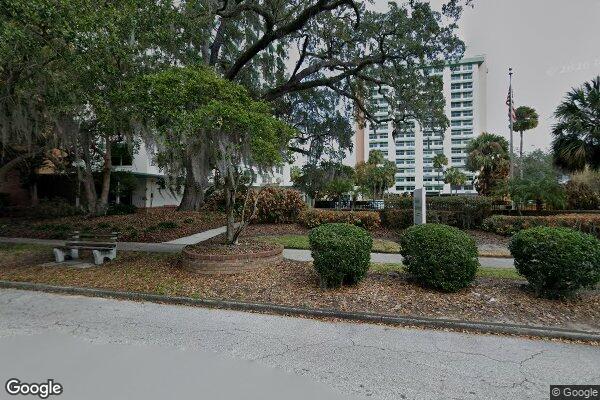
517 S Delaney Ave
705 GREENWOOD ST
14 properties
View income and AMI reference data for saint petersburg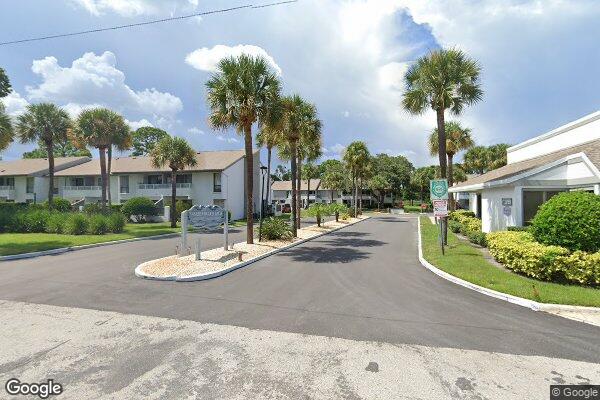
2099 54th Ave South
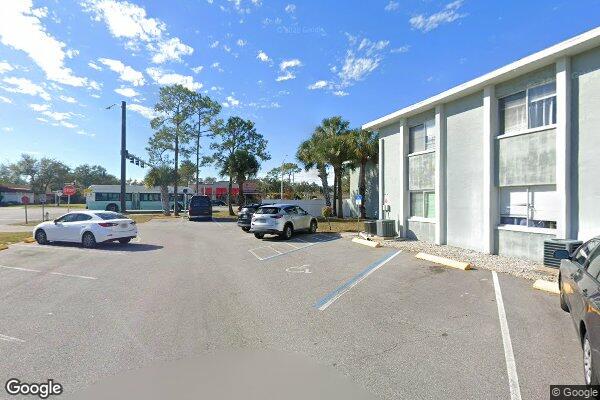
379 47th Ave N
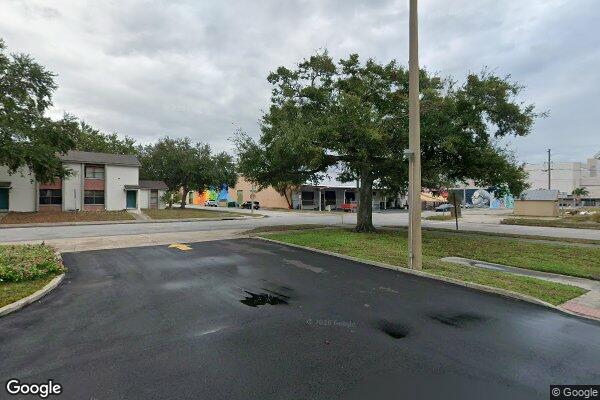
1000 BURLINGTON AVE N
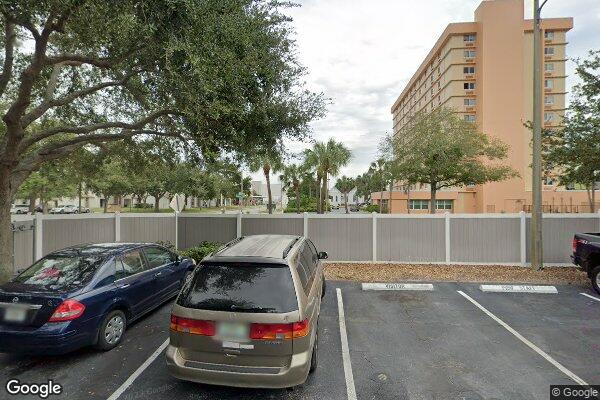
1029 Burlington Ave N
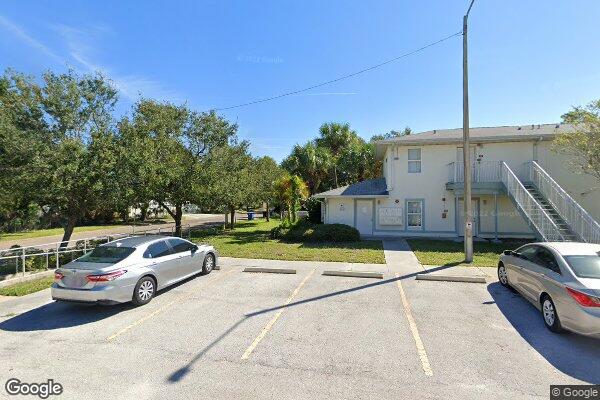
836 34th Avenue
5353 31ST ST N
12 properties
View income and AMI reference data for clearwater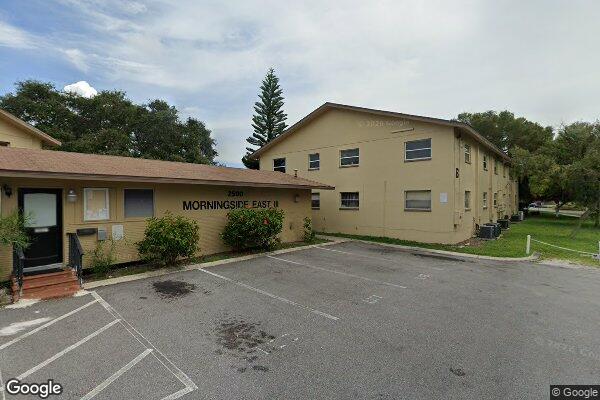
2500 HARN BLVD
2500 Harn Blvd
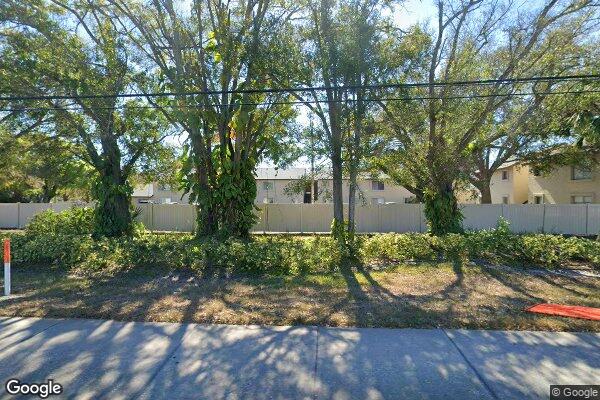
4215 E BAY DR
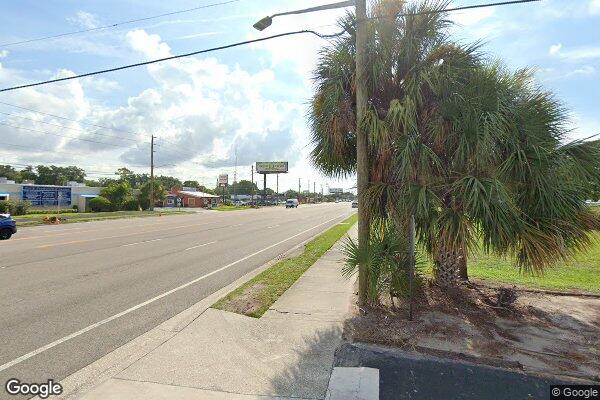
2285 STATE ROAD 580
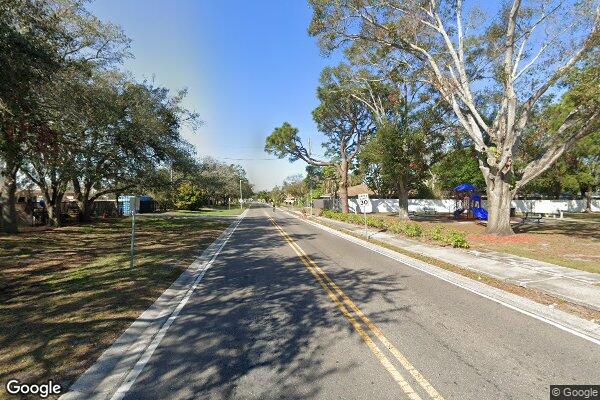
1000 N KEENE RD
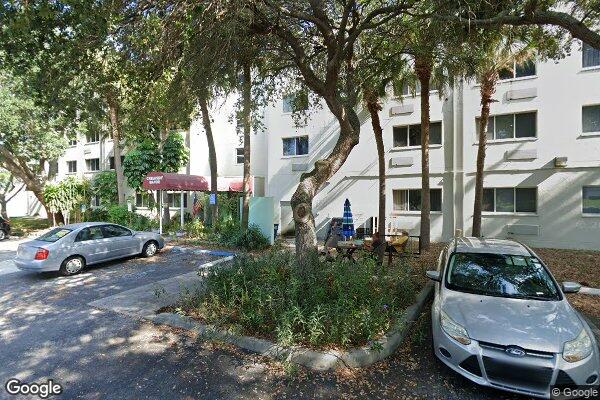
1318 FRANKLIN ST
HUD Small Area Fair Market Rents (SAFMR) are rental benchmarks used in housing programs; they do not set each voucher household's payment standard across Florida (FL). Across 45 HUD FMR areas and 260 listed communities in Florida (1,530 LIHTC tax credit, 441 Project-Based Section 8, 355 Section 202 senior, 374 USDA Rural Development), the property-location-weighted Fair Market Rent summary is $1,528/month for a 1-bedroom and $1,815/month for a 2-bedroom. Local Public Housing Agencies set their own voucher payment standards. The 90%–110% figures below are illustrative calculations from FMR, not guaranteed or official local payment standards.
| Unit Size | Illustrative 90% of FMR | Property-location-weighted FMR | Illustrative 110% of FMR | FL ZIP FMR Range (Min – Max) |
|---|---|---|---|---|
| Studio / Efficiency | $1,279/mo | $1,421/mo | $1,563/mo | $670 – $2,740/mo |
| 1 Bedroom | $1,375/mo | $1,528/mo | $1,681/mo | $740 – $2,990/mo |
| 2 Bedroom | $1,633/mo | $1,815/mo | $1,996/mo | $970 – $3,650/mo |
| 3 Bedroom | $2,110/mo | $2,344/mo | $2,578/mo | $1,220 – $4,680/mo |
| 4 Bedroom | $2,475/mo | $2,750/mo | $3,025/mo | $1,290 – $5,410/mo |
Source: HUD Small Area Fair Market Rents (SAFMR). Geography: property ZIP-code locations in Florida. Dataset year: not recorded in the local FMR table. The 90% and 110% columns are illustrative calculations; local PHAs set their own voucher payment standards.
| HUD Metro / FMR Area | Studio | 1 BR | 2 BR | 3 BR | 4 BR | HUD 4-Person Median Family Income | HUD fiscal year | Properties |
|---|---|---|---|---|---|---|---|---|
| Miami-Miami Beach-Kendall, FL HUD Metro FMR Area48 ZIPs | $1,736 | $1,893 | $2,312 | $2,970 | $3,444 | $95,688 | FY2026 | 385 |
| Tampa-St. Petersburg-Clearwater, FL MSA74 ZIPs | $1,541 | $1,640 | $1,912 | $2,444 | $2,974 | $100,124 | FY2026 | 319 |
| Orlando-Kissimmee-Sanford, FL MSA58 ZIPs | $1,583 | $1,661 | $1,893 | $2,377 | $2,818 | $99,392 | FY2026 | 304 |
| Jacksonville, FL HUD Metro FMR Area35 ZIPs | $1,235 | $1,261 | $1,509 | $1,864 | $2,339 | $96,183 | FY2026 | 179 |
| Fort Lauderdale, FL HUD Metro FMR Area36 ZIPs | $1,710 | $1,871 | $2,297 | $3,146 | $3,725 | $106,095 | FY2026 | 128 |
| West Palm Beach-Boca Raton, FL HUD Metro FMR Area23 ZIPs | $1,618 | $1,720 | $2,039 | $2,640 | $3,063 | $108,723 | FY2026 | 108 |
| Lakeland-Winter Haven, FL MSA25 ZIPs | $1,137 | $1,143 | $1,388 | $1,868 | $2,320 | $73,767 | FY2026 | 91 |
| North Port-Bradenton-Sarasota, FL MSA19 ZIPs | $1,241 | $1,459 | $1,705 | $2,215 | $2,646 | $107,980 | FY2026 | 84 |
| Deltona-Daytona Beach-Ormond Beach, FL HUD Metro FMR Area17 ZIPs | $1,219 | $1,388 | $1,694 | $2,229 | $2,446 | $86,324 | FY2026 | 65 |
| Pensacola-Ferry Pass-Brent, FL MSA12 ZIPs | $1,144 | $1,287 | $1,512 | $2,014 | $2,464 | $89,465 | FY2026 | 56 |
| Cape Coral-Fort Myers, FL MSA16 ZIPs | $1,498 | $1,528 | $1,833 | $2,396 | $2,657 | $99,028 | FY2026 | 53 |
| Tallahassee, FL HUD Metro FMR Area16 ZIPs | $1,057 | $1,167 | $1,306 | $1,630 | $1,767 | $76,318 | FY2026 | 49 |
Source: HUD User Income Limits and HUD SAFMR. Each row is a HUD area represented by listed property locations; the displayed HUD fiscal year is the latest available for that area. HUD income limits are reference data and do not establish official LIHTC/MTSP limits.
| Property-Location-Weighted Indicator | Florida Property-Location Summary |
|---|---|
| Median gross rent (U.S. Census ACS) | $1,367/mo |
| Property-location-weighted 2-Bedroom HUD Fair Market Rent (SAFMR) | $1,815/mo |
| Estimated property-location-weighted 4-person income benchmark | $76,596/yr |
| Median household income (Census ACS) | $60,874/yr |
| Renter-occupied housing share | 41.7% |
| Cost-burdened renters (spending 30%+ of income on rent) | 58.8% |
| Severely cost-burdened renters (spending 50%+ of income on rent) | 30.8% |
Source: U.S. Census ACS 5-year ZIP-code data and HUD SAFMR. Geography: ZIP-code locations represented by listed properties in Florida. Dataset year: not recorded or mixed in the local data. The summary is property-location-weighted and is not an official statewide qualification limit.
Methodology: Fair Market Rent benchmarks are summarized from HUD Small Area Fair Market Rents (SAFMR), HUD income limits by their latest available fiscal year, and U.S. Census ACS 5-year ZIP-code estimates across represented property locations in Florida. The local dataset does not record an FMR year. Local Public Housing Agencies (PHAs) establish their own payment standards; the 90%–110% figures are illustrative calculations only.