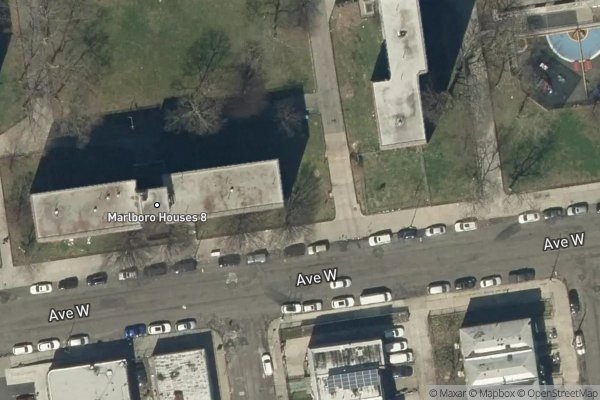
MARLBORO HOUSES
29 AVENUE W
Income Based
Calculated by HUD
Income-Based Rent1765 Units
View Property
Browse 216 Public Housing development records in New York, organized by city. Confirm current operation, responsible PHA, eligibility, and waitlist status with the agency.
HUD source-data date: not recorded. Data compilation and directory sync dates are not the HUD observation date.
Sources: HUD, USDA Rural Development, HUD LIHTC Database. See HUD's Public Housing Occupancy Guidebook and utility allowance guidance.
This preliminary check is not an eligibility decision. Confirm rules with the administering agency.
Public Housing developments are administered by local Public Housing Agencies (PHAs). Income limits, annual admission targeting, local preferences, rent calculations, and application procedures vary under federal rules and local PHA policies. Use HUD's PHA directory to identify and confirm the agency responsible for a development. Any HUD-reported wait-time figure on a property page is a historical average among admissions, not a current wait estimate.
29 AVENUE W
237 Nassau St
275 Livonia Ave
542 Marcy Ave
82 Dwight St
2926 W 25th St
1760 Lexington Ave
200 W 143rd St
3170 Broadway
420 W 19th St
100 Pitt St
241 W 101st St
1660 Story Ave
750 E 163rd St
1785 Story Ave
680 Tinton Ave
321 E 153rd St
228 W Tremont Ave
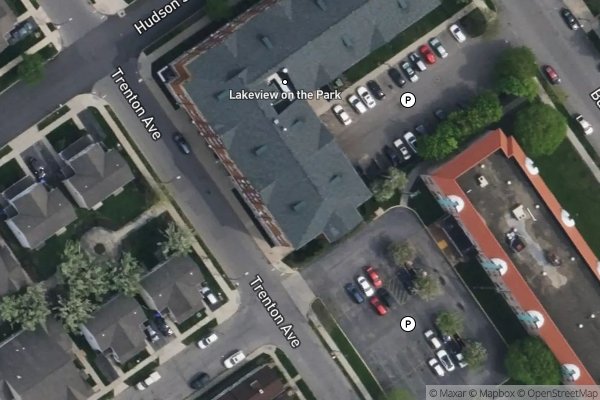
345 TRENTON AVE
368 Broadway St
326 Edison Ave
103A Langfield Dr
167 10th St Apt 1
134 Isabelle St
7115 Beach Channel Dr
7040 Parsons Blvd
4109 12th St
3550 21st St
1302 Redfern Ave
10616 159th St
80 Cunningham St
62 Vienna St
45 Coretta Scott Xing
140 West Ave
625 University Ave
50 Edith St
HUD Small Area Fair Market Rents (SAFMR) are rental benchmarks used in housing programs; they do not set each voucher household's payment standard across New York (NY). Across 38 HUD FMR areas and 216 listed communities in New York (4,026 LIHTC tax credit, 798 Project-Based Section 8, 656 Section 202 senior, 389 USDA Rural Development), the property-location-weighted Fair Market Rent summary is $2,046/month for a 1-bedroom and $2,319/month for a 2-bedroom. Local Public Housing Agencies set their own voucher payment standards. The 90%–110% figures below are illustrative calculations from FMR, not guaranteed or official local payment standards.
| Unit Size | Illustrative 90% of FMR | Property-location-weighted FMR | Illustrative 110% of FMR | NY ZIP FMR Range (Min – Max) |
|---|---|---|---|---|
| Studio / Efficiency | $1,731/mo | $1,924/mo | $2,116/mo | $670 – $3,800/mo |
| 1 Bedroom | $1,841/mo | $2,046/mo | $2,250/mo | $740 – $3,990/mo |
| 2 Bedroom | $2,087/mo | $2,319/mo | $2,550/mo | $970 – $4,370/mo |
| 3 Bedroom | $2,602/mo | $2,892/mo | $3,181/mo | $1,170 – $5,470/mo |
| 4 Bedroom | $2,838/mo | $3,153/mo | $3,469/mo | $1,290 – $5,950/mo |
Source: HUD Small Area Fair Market Rents (SAFMR). Geography: property ZIP-code locations in New York. Dataset year: not recorded in the local FMR table. The 90% and 110% columns are illustrative calculations; local PHAs set their own voucher payment standards.
| HUD Metro / FMR Area | Studio | 1 BR | 2 BR | 3 BR | 4 BR | HUD 4-Person Median Family Income | HUD fiscal year | Properties |
|---|---|---|---|---|---|---|---|---|
| New York, NY HUD Metro FMR Area195 ZIPs | $2,518 | $2,637 | $2,902 | $3,626 | $3,933 | $140,724 | FY2026 | 2,925 |
| Rochester, NY MSA77 ZIPs | $1,113 | $1,254 | $1,568 | $1,891 | $2,085 | $98,019 | FY2026 | 545 |
| Buffalo-Cheektowaga, NY MSA63 ZIPs | $1,071 | $1,104 | $1,304 | $1,595 | $1,819 | $99,428 | FY2026 | 316 |
| Syracuse, NY MSA55 ZIPs | $982 | $1,102 | $1,362 | $1,662 | $1,836 | $93,983 | FY2026 | 206 |
| Nassau-Suffolk, NY HUD Metro FMR Area65 ZIPs | $2,090 | $2,448 | $2,808 | $3,627 | $3,849 | $167,401 | FY2026 | 205 |
| Albany-Schenectady-Troy, NY MSA50 ZIPs | $1,182 | $1,369 | $1,645 | $1,974 | $2,179 | $112,613 | FY2026 | 183 |
| Kiryas Joel-Poughkeepsie-Newburgh, NY MSA31 ZIPs | $1,414 | $1,583 | $1,982 | $2,513 | $2,699 | $130,504 | FY2026 | 138 |
| Utica-Rome, NY MSA20 ZIPs | $889 | $913 | $1,155 | $1,394 | $1,615 | $95,862 | FY2026 | 72 |
| Watertown-Fort Drum, NY MSA20 ZIPs | $870 | $958 | $1,256 | $1,704 | $2,089 | $89,919 | FY2026 | 59 |
| Binghamton, NY MSA22 ZIPs | $844 | $919 | $1,155 | $1,475 | $1,683 | $86,714 | FY2026 | 53 |
| Kingston, NY MSA20 ZIPs | $1,341 | $1,405 | $1,833 | $2,291 | $2,462 | $116,418 | FY2026 | 52 |
| Chautauqua County, NY12 ZIPs | $715 | $791 | $1,023 | $1,350 | $1,358 | $90,183 | FY2026 | 39 |
Source: HUD User Income Limits and HUD SAFMR. Each row is a HUD area represented by listed property locations; the displayed HUD fiscal year is the latest available for that area. HUD income limits are reference data and do not establish official LIHTC/MTSP limits.
| Property-Location-Weighted Indicator | New York Property-Location Summary |
|---|---|
| Median gross rent (U.S. Census ACS) | $1,439/mo |
| Property-location-weighted 2-Bedroom HUD Fair Market Rent (SAFMR) | $2,319/mo |
| Estimated property-location-weighted 4-person income benchmark | $89,307/yr |
| Median household income (Census ACS) | $70,364/yr |
| Renter-occupied housing share | 61.4% |
| Cost-burdened renters (spending 30%+ of income on rent) | 52.1% |
| Severely cost-burdened renters (spending 50%+ of income on rent) | 28.3% |
Source: U.S. Census ACS 5-year ZIP-code data and HUD SAFMR. Geography: ZIP-code locations represented by listed properties in New York. Dataset year: not recorded or mixed in the local data. The summary is property-location-weighted and is not an official statewide qualification limit.
Methodology: Fair Market Rent benchmarks are summarized from HUD Small Area Fair Market Rents (SAFMR), HUD income limits by their latest available fiscal year, and U.S. Census ACS 5-year ZIP-code estimates across represented property locations in New York. The local dataset does not record an FMR year. Local Public Housing Agencies (PHAs) establish their own payment standards; the 90%–110% figures are illustrative calculations only.