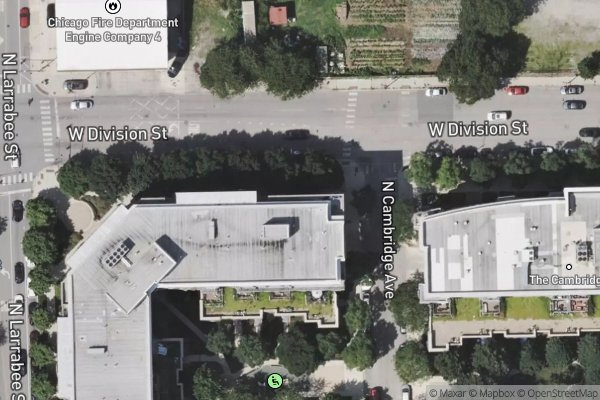
PARKSIDE 9
545 W DIVISION ST
Income Based
Calculated by HUD
Income-Based Rent111 Units
View Property
Browse 196 Public Housing development records in Illinois, organized by city. Confirm current operation, responsible PHA, eligibility, and waitlist status with the agency.
HUD source-data date: not recorded. Data compilation and directory sync dates are not the HUD observation date.
Sources: HUD, USDA Rural Development, HUD LIHTC Database. See HUD's Public Housing Occupancy Guidebook and utility allowance guidance.
This preliminary check is not an eligibility decision. Confirm rules with the administering agency.
Public Housing developments are administered by local Public Housing Agencies (PHAs). Income limits, annual admission targeting, local preferences, rent calculations, and application procedures vary under federal rules and local PHA policies. Use HUD's PHA directory to identify and confirm the agency responsible for a development. Any HUD-reported wait-time figure on a property page is a historical average among admissions, not a current wait estimate.
545 W DIVISION ST
700 E 133rd Pl
900 N Kingsbury St
815 N Cambridge Ave
551 W North Ave
2020 W Schiller St
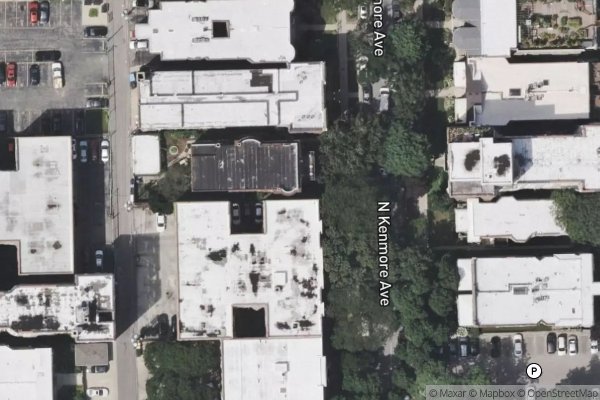
5650 N KENMORE AVE
900 N Kingsbury St
815 N Cambridge Ave
2764 N Hoyne Ave
551 W North Ave
2020 W Schiller St
1502 Spring Ct
511 N Church St
1133 Benton St
2221 N Winnebago St
712 N Chicago Ave
1922 Fremont St
1213 E Washington St
400 N 17th St
1508 E Reynolds St
1101 E Reynolds St
623 E Black Ave Apt A
401 W Allen St
2604 W Krause Ave
2022 S Friedan St
812 W McBean St
1201 SW Jefferson Ave
930 W Millman St
2625 W Reservoir Blvd
1221 N Van Dyke St
333 E Center St
719 Cassell Ct
1001 N Ml King
601 E Condit St
450 E Leafland Ave
HUD Small Area Fair Market Rents (SAFMR) are rental benchmarks used in housing programs; they do not set each voucher household's payment standard across Illinois (IL). Across 78 HUD FMR areas and 196 listed communities in Illinois (1,479 LIHTC tax credit, 515 Project-Based Section 8, 343 Section 202 senior, 462 USDA Rural Development), the property-location-weighted Fair Market Rent summary is $1,172/month for a 1-bedroom and $1,384/month for a 2-bedroom. Local Public Housing Agencies set their own voucher payment standards. The 90%–110% figures below are illustrative calculations from FMR, not guaranteed or official local payment standards.
| Unit Size | Illustrative 90% of FMR | Property-location-weighted FMR | Illustrative 110% of FMR | IL ZIP FMR Range (Min – Max) |
|---|---|---|---|---|
| Studio / Efficiency | $979/mo | $1,088/mo | $1,197/mo | $630 – $2,220/mo |
| 1 Bedroom | $1,055/mo | $1,172/mo | $1,290/mo | $700 – $2,370/mo |
| 2 Bedroom | $1,246/mo | $1,384/mo | $1,523/mo | $920 – $2,670/mo |
| 3 Bedroom | $1,609/mo | $1,788/mo | $1,967/mo | $1,100 – $3,440/mo |
| 4 Bedroom | $1,840/mo | $2,045/mo | $2,249/mo | $1,210 – $3,980/mo |
Source: HUD Small Area Fair Market Rents (SAFMR). Geography: property ZIP-code locations in Illinois. Dataset year: not recorded in the local FMR table. The 90% and 110% columns are illustrative calculations; local PHAs set their own voucher payment standards.
| HUD Metro / FMR Area | Studio | 1 BR | 2 BR | 3 BR | 4 BR | HUD 4-Person Median Family Income | HUD fiscal year | Properties |
|---|---|---|---|---|---|---|---|---|
| Chicago-Joliet-Naperville, IL HUD Metro FMR Area187 ZIPs | $1,463 | $1,565 | $1,766 | $2,276 | $2,631 | $126,145 | FY2026 | 1,145 |
| St. Louis, MO-IL HUD Metro FMR Area53 ZIPs | $853 | $892 | $1,096 | $1,407 | $1,639 | $100,589 | FY2026 | 166 |
| Peoria, IL MSA33 ZIPs | $742 | $796 | $1,013 | $1,322 | $1,417 | $97,877 | FY2026 | 100 |
| Davenport-Moline-Rock Island, IA-IL MSA24 ZIPs | $764 | $859 | $1,061 | $1,389 | $1,676 | $95,579 | FY2026 | 84 |
| Rockford, IL MSA18 ZIPs | $800 | $886 | $1,162 | $1,537 | $1,578 | $93,070 | FY2026 | 69 |
| Springfield, IL MSA13 ZIPs | $819 | $959 | $1,189 | $1,593 | $1,662 | $105,658 | FY2026 | 61 |
| Bloomington, IL MSA17 ZIPs | $844 | $907 | $1,171 | $1,534 | $1,574 | $107,936 | FY2026 | 54 |
| Champaign-Urbana, IL HUD Metro FMR Area18 ZIPs | $926 | $935 | $1,110 | $1,439 | $1,479 | $102,946 | FY2026 | 45 |
| Decatur, IL MSA11 ZIPs | $856 | $876 | $1,102 | $1,426 | $1,764 | $94,031 | FY2026 | 37 |
| Lee County, IL6 ZIPs | $660 | $771 | $927 | $1,249 | $1,321 | $83,178 | FY2026 | 32 |
| DeKalb County, IL HUD Metro FMR Area10 ZIPs | $925 | $1,025 | $1,339 | $1,802 | $2,191 | $97,862 | FY2026 | 28 |
| Macoupin County, IL HUD Metro FMR Area9 ZIPs | $701 | $723 | $948 | $1,160 | $1,384 | $87,141 | FY2026 | 28 |
Source: HUD User Income Limits and HUD SAFMR. Each row is a HUD area represented by listed property locations; the displayed HUD fiscal year is the latest available for that area. HUD income limits are reference data and do not establish official LIHTC/MTSP limits.
| Property-Location-Weighted Indicator | Illinois Property-Location Summary |
|---|---|
| Median gross rent (U.S. Census ACS) | $1,061/mo |
| Property-location-weighted 2-Bedroom HUD Fair Market Rent (SAFMR) | $1,384/mo |
| Estimated property-location-weighted 4-person income benchmark | $92,683/yr |
| Median household income (Census ACS) | $66,761/yr |
| Renter-occupied housing share | 40.9% |
| Cost-burdened renters (spending 30%+ of income on rent) | 47.4% |
| Severely cost-burdened renters (spending 50%+ of income on rent) | 24.1% |
Source: U.S. Census ACS 5-year ZIP-code data and HUD SAFMR. Geography: ZIP-code locations represented by listed properties in Illinois. Dataset year: not recorded or mixed in the local data. The summary is property-location-weighted and is not an official statewide qualification limit.
Methodology: Fair Market Rent benchmarks are summarized from HUD Small Area Fair Market Rents (SAFMR), HUD income limits by their latest available fiscal year, and U.S. Census ACS 5-year ZIP-code estimates across represented property locations in Illinois. The local dataset does not record an FMR year. Local Public Housing Agencies (PHAs) establish their own payment standards; the 90%–110% figures are illustrative calculations only.