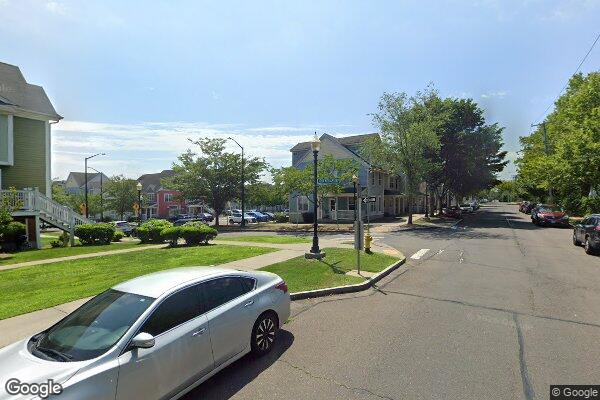
TRINITY NEW HAVEN HOUSING
2 JOHN WILLIAMSON DR
Income Based
Calculated by HUD
Income-Based Rent81 Units
View Property
Browse 96 Public Housing development records in Connecticut, organized by city. Confirm current operation, responsible PHA, eligibility, and waitlist status with the agency.
HUD source-data date: not recorded. Data compilation and directory sync dates are not the HUD observation date.
Sources: HUD, USDA Rural Development, HUD LIHTC Database. See HUD's Public Housing Occupancy Guidebook and utility allowance guidance.
This preliminary check is not an eligibility decision. Confirm rules with the administering agency.
Public Housing developments are administered by local Public Housing Agencies (PHAs). Income limits, annual admission targeting, local preferences, rent calculations, and application procedures vary under federal rules and local PHA policies. Use HUD's PHA directory to identify and confirm the agency responsible for a development. Any HUD-reported wait-time figure on a property page is a historical average among admissions, not a current wait estimate.
2 JOHN WILLIAMSON DR
2 Catherine St
1 Del Rio Dr
859 Woodward Ave
23A Chamberlain St
2 Lodge St
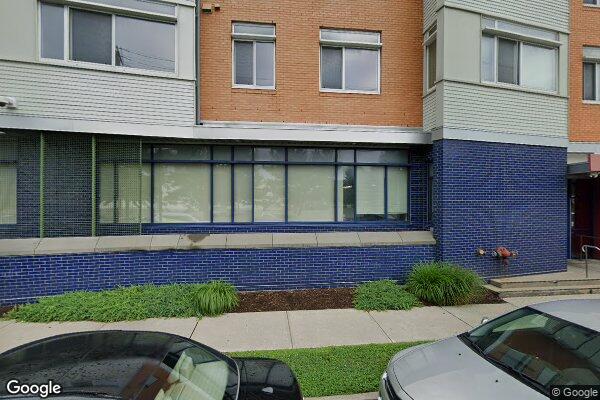
36 ALBION ST
716 Pembroke St
1260 Boston Ave
1810 Stratford Ave
467 Bird St
12 Garden St
20 West Ave
57 Ward St
1 Emerson St
261 Ely Ave
9 Union Ave
20 Day St
38 Beckerle St
84 W Wooster St
148 Eden Dr
13 Hoyt St
49 Highland Ave
36 W Wooster St Apt 311
174A Harrison Ave
73 Jepson Dr Apt 1
75 De Maio Dr
10A Housatonic Ave
264 High St
100 Viscount Dr
10 W Clay St
23 Harris Cir
27 Kearney Dr
70 Lakewood Rd
125 Fairmount St
HUD Small Area Fair Market Rents (SAFMR) are rental benchmarks used in housing programs; they do not set each voucher household's payment standard across Connecticut (CT). Across 10 HUD FMR areas and 96 listed communities in Connecticut (433 LIHTC tax credit, 191 Project-Based Section 8, 141 Section 202 senior, 122 USDA Rural Development), the property-location-weighted Fair Market Rent summary is $1,666/month for a 1-bedroom and $2,051/month for a 2-bedroom. Local Public Housing Agencies set their own voucher payment standards. The 90%–110% figures below are illustrative calculations from FMR, not guaranteed or official local payment standards.
| Unit Size | Illustrative 90% of FMR | Property-location-weighted FMR | Illustrative 110% of FMR | CT ZIP FMR Range (Min – Max) |
|---|---|---|---|---|
| Studio / Efficiency | $1,278/mo | $1,420/mo | $1,561/mo | $900 – $2,520/mo |
| 1 Bedroom | $1,499/mo | $1,666/mo | $1,833/mo | $1,030 – $3,050/mo |
| 2 Bedroom | $1,846/mo | $2,051/mo | $2,256/mo | $1,300 – $3,650/mo |
| 3 Bedroom | $2,258/mo | $2,509/mo | $2,760/mo | $1,560 – $4,410/mo |
| 4 Bedroom | $2,645/mo | $2,939/mo | $3,233/mo | $1,770 – $5,230/mo |
Source: HUD Small Area Fair Market Rents (SAFMR). Geography: property ZIP-code locations in Connecticut. Dataset year: not recorded in the local FMR table. The 90% and 110% columns are illustrative calculations; local PHAs set their own voucher payment standards.
| HUD Metro / FMR Area | Studio | 1 BR | 2 BR | 3 BR | 4 BR | HUD 4-Person Median Family Income | HUD fiscal year | Properties |
|---|---|---|---|---|---|---|---|---|
| Hartford-West Hartford-East Hartford, CT MSA60 ZIPs | $1,287 | $1,482 | $1,867 | $2,254 | $2,581 | $137,126 | FY2026 | 266 |
| Bridgeport-Stamford-Danbury, CT MSA36 ZIPs | $1,788 | $2,169 | $2,594 | $3,140 | $3,706 | $164,654 | FY2026 | 180 |
| New Haven, CT MSA22 ZIPs | $1,403 | $1,617 | $1,999 | $2,469 | $2,929 | $126,915 | FY2026 | 131 |
| Waterbury-Shelton, CT MSA16 ZIPs | $1,238 | $1,437 | $1,777 | $2,201 | $2,596 | $118,988 | FY2026 | 55 |
| Norwich-New London-Willimantic, CT MSA12 ZIPs | $1,277 | $1,487 | $1,852 | $2,389 | $2,954 | $120,078 | FY2026 | 46 |
| Northwest Hills Planning Region, CT9 ZIPs | $1,140 | $1,351 | $1,658 | $2,132 | $2,402 | $122,488 | FY2026 | 24 |
| Northeastern Connecticut Planning Region, CT7 ZIPs | $1,133 | $1,319 | $1,624 | $2,087 | $2,372 | $117,063 | FY2026 | 17 |
| Waterbury-Shelton, CT MSA1 ZIP | $1,170 | $1,420 | $1,710 | $2,060 | $2,870 | $126,705 | FY2026 | 3 |
| Hartford-West Hartford-East Hartford, CT MSA1 ZIP | $1,250 | $1,440 | $1,820 | $2,180 | $2,540 | $148,602 | FY2026 | 2 |
| Hartford-West Hartford-East Hartford, CT MSA1 ZIP | $1,670 | $1,920 | $2,420 | $2,900 | $3,290 | $168,445 | FY2026 | 1 |
Source: HUD User Income Limits and HUD SAFMR. Each row is a HUD area represented by listed property locations; the displayed HUD fiscal year is the latest available for that area. HUD income limits are reference data and do not establish official LIHTC/MTSP limits.
| Property-Location-Weighted Indicator | Connecticut Property-Location Summary |
|---|---|
| Median gross rent (U.S. Census ACS) | $1,476/mo |
| Property-location-weighted 2-Bedroom HUD Fair Market Rent (SAFMR) | $2,051/mo |
| Estimated property-location-weighted 4-person income benchmark | $101,692/yr |
| Median household income (Census ACS) | $82,491/yr |
| Renter-occupied housing share | 48% |
| Cost-burdened renters (spending 30%+ of income on rent) | 52.2% |
| Severely cost-burdened renters (spending 50%+ of income on rent) | 27.2% |
Source: U.S. Census ACS 5-year ZIP-code data and HUD SAFMR. Geography: ZIP-code locations represented by listed properties in Connecticut. Dataset year: not recorded or mixed in the local data. The summary is property-location-weighted and is not an official statewide qualification limit.
Methodology: Fair Market Rent benchmarks are summarized from HUD Small Area Fair Market Rents (SAFMR), HUD income limits by their latest available fiscal year, and U.S. Census ACS 5-year ZIP-code estimates across represented property locations in Connecticut. The local dataset does not record an FMR year. Local Public Housing Agencies (PHAs) establish their own payment standards; the 90%–110% figures are illustrative calculations only.